
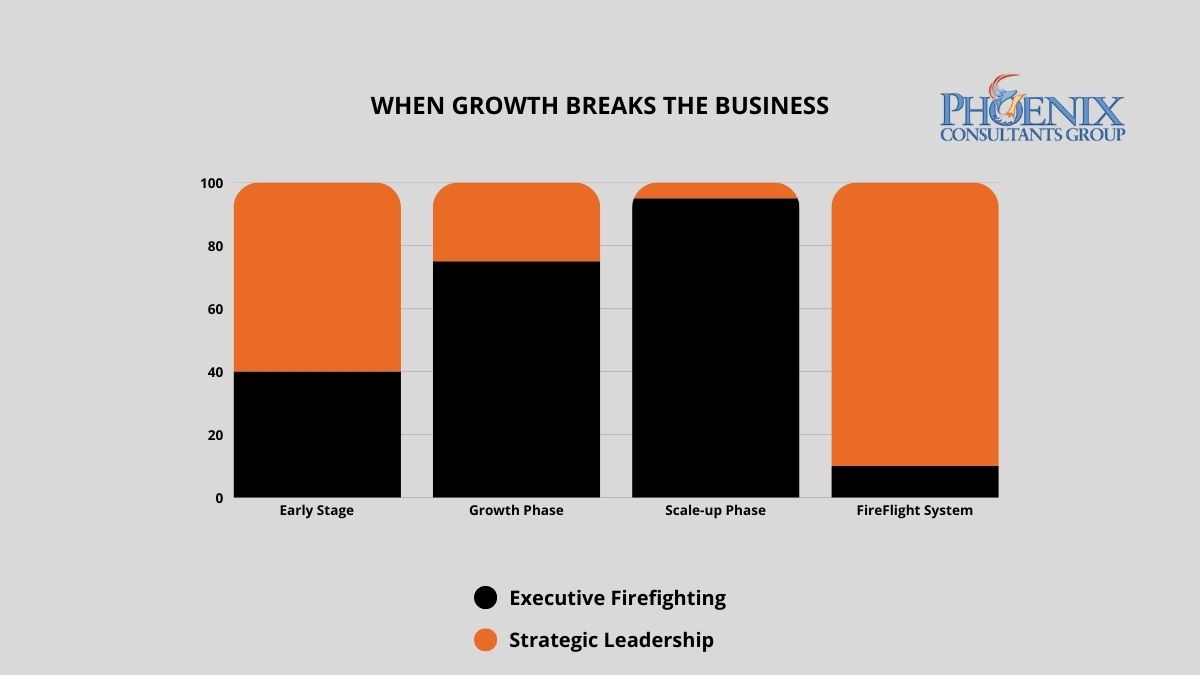
Why does growth create chaos instead of momentum?
The pattern has a name worth knowing: architectural lag, where operational complexity outgrows the systems meant to carry it. A manual process that was fine at a million in revenue becomes a bottleneck a few times larger, and the primary constraint on the business not long after that. Nothing went wrong in the usual sense. The business simply outran the architecture it was built on, and every workaround added to keep going made the next stage harder to see.
This is where the broader market has landed too. In February 2026, Gartner described many older business systems as monolithic, for what it called their infamous inflexibility, and pointed to modern platforms that embrace modular composability as the way to add capability without a rebuild.1 The answer to a fragmented, overloaded stack is a single unified architecture, not another tool bolted onto the pile.
What does the cost of architectural lag look like at the leadership level?
The clearest measure is where the CEO's week goes. The more the architecture lags, the more executive time is spent inside the operation rather than ahead of it.
| Operational state | Where leadership time goes | Capacity to lead strategically |
|---|---|---|
| Chaos: legacy or manual stack | Most of the week resolving recurring failures and data mismatches | Low. The business runs the CEO. |
| Reactive: patchwork or partial ERP | A large share of the week still goes to firefighting between systems | Partial. Strategy competes with crises. |
| Strategic: unified architecture | Little time on system failures; attention moves to planning | High. Growth is no longer capped by the infrastructure. |
A unified architecture does more than cut the number of fires. It removes many of the conditions that start them, so the shift is toward planning rather than reacting, and it tends to arrive not long after a full deployment settles in.
How do I know if the chaos is coming from my systems or my team?
If four or more of these five patterns describe your week, the growth ceiling is structural, and no amount of hiring will move it on its own.
- The morning fire. The day starts by resolving the same category of system error or data mismatch, again.
- The expansion hold. A market opportunity gets postponed because no one trusts the systems to carry the extra load.
- The visibility gap. Basic operational questions, this month's margin, current inventory, billable hours, cannot be answered quickly.
- The single-system dependency. One person is the only administrator of a system the business cannot run without.
- The reconciliation meeting. Leadership spends its time reconciling conflicting numbers pulled from disconnected sources instead of deciding with them.
See what one unified architecture does to the week.
FireFlight is PCG's configurable platform that replaces the fragmented stack. Try it for 14 days, no obligation.
What operational problems does a unified architecture address at each growth stage?
The symptom differs by sector, but the root is the same: data that has to be moved by hand between systems that do not talk to each other.
Manufacturing and industrial
Floor data, job costing, and inventory bridged to accounting by hand, so the numbers never quite agree.
Environmental and compliance
Permit, manifest, and inspection records that must hold a full audit trail across jurisdictions.
Healthcare staffing and multi-site
Scheduling, credentialing, and payroll accuracy that have to stay in step across every facility.
Fleet and field service
Dispatch, compliance, and billing data carried back from the field and re-entered by hand.
What does the move from operational chaos to architectural stability look like?
PCG runs it in three phases, in parallel with live operations so the business keeps running. The scope and schedule depend on the current stack and are set during the first phase, not promised in advance.
- System stress testA diagnostic that maps the manual steps, the conflicting data, and the person-dependent processes, ranked by how much leadership time each one consumes. Nothing changes in your systems during this phase.
- Architectural harmonizationFireFlight is deployed in parallel with live operations, migrating the data and resolving the friction points in sequence, so the business keeps working while the new architecture comes together underneath it.
- Strategic handoffLeadership moves to management by exception, with automated flags and a real-time executive dashboard, so attention goes to the few things that need a decision rather than the many that used to need a rescue. Your data stays yours throughout, in a standard format.
Start with a clear picture of where the time goes.
Run a 14-day free trial of FireFlight and see what a unified architecture takes off the CEO's plate.
Frequently Asked Questions
1 Gartner, press release on embedded AI in cloud ERP applications, February 24, 2026, quoting Mike Helsel, Senior Director, Research, on legacy systems earning the descriptor "monolithic" for their inflexibility and on modern low-code flexibility and modular composability. gartner.com
2 Leadership time-allocation patterns reflect PCG pre-engagement assessments across mid-market operations.
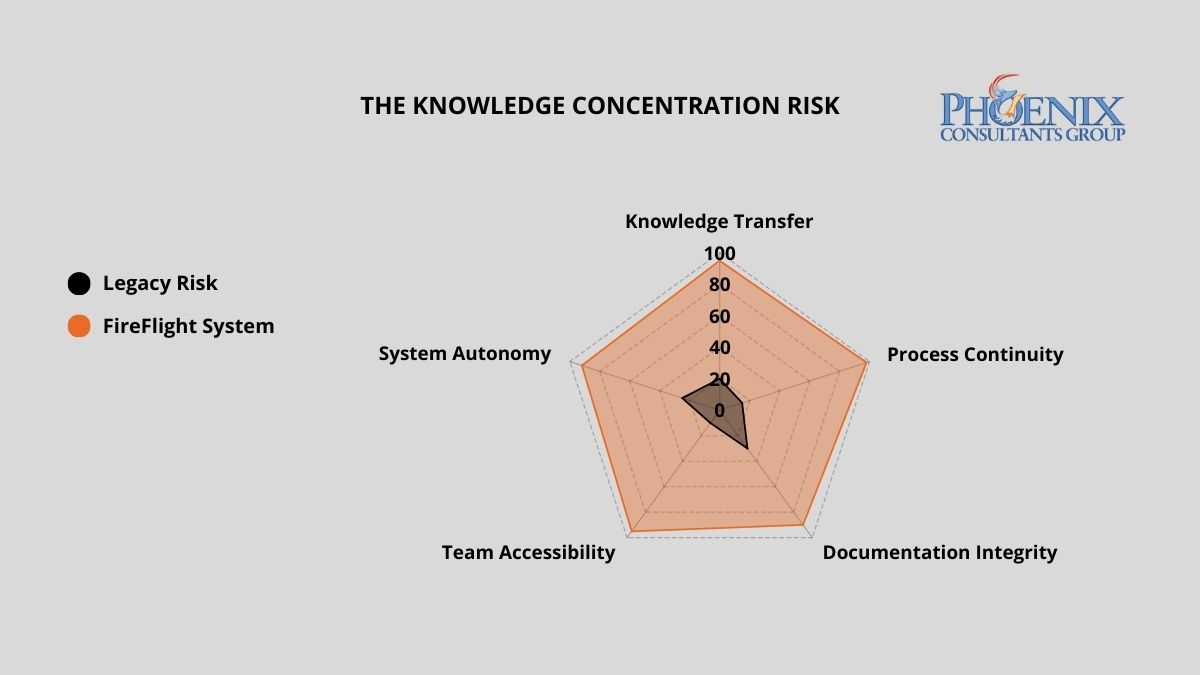
Why do organizations end up with systems only one person can operate?
It happens gradually, usually during a stretch of fast growth. Someone capable builds a quick workaround, a macro, a script, a patch, to keep things moving, and it works. Over a few years those fixes accumulate into a system that only their author fully understands. What started as resourcefulness becomes a black box: a working system nobody else can safely change, and a business quietly dependent on one person staying, staying reachable, and remembering how it all fits together.
The 2026 data shows where that leads. In Uptime Institute's 2025 outage analysis, nearly 40 percent of organizations reported a major outage caused by human error in the previous three years, and about 85 percent of those traced back to staff not following procedures or to the procedures themselves being flawed.1 When the real procedure lives in one person's head rather than in the system, that is exactly the failure waiting to happen.
What does key-man dependency actually cost when it becomes an incident?
The cost is not only the hours of downtime. It is the hold one departure has over the whole operation, and it scales with how much of the system lives outside the software. The three models below show the difference in plain terms.
| Model | Reliance on one expert | What happens if that person leaves |
|---|---|---|
| Black box: undocumented custom | High. Day-to-day operation and every fix route through one person. | Operational paralysis until someone reverse-engineers the system. |
| Standard ERP: generic, documented | Moderate. Documented, but fitted to your process through settings only that person knows. | Significant disruption and a retraining lag while someone relearns the setup. |
| Transparent system: logic in the software | Minimal. The rules and validations live in the application, not in a person. | Little disruption. A qualified professional picks it up from the documented system. |
How do I know if my organization is already inside the Expert Trap?
Three warning signs tend to appear together. Two or more is a sign the risk is structural, not occasional.
The key-man query
When something breaks, staff call one specific person by name, not a process or a help desk.
The manual secret
Certain reports or functions depend on undocumented steps only one or two people know how to run.
The update fear
Staff avoid updates, new users, or workflow changes because they are afraid of breaking something no one can fix.
See what a system without a single point of failure feels like.
FireFlight is PCG's configurable platform, with the business logic in the software and documented from the start. Try it for 14 days, no obligation.
What makes a transparent system different from one that creates key-man dependency?
A transparent system keeps its rules where they can be seen and maintained. The business logic, the validations, the permissions, and the reports live inside the application rather than in a person's memory or a side file, and the architecture comes documented. Because it runs on standard, documented technology, .NET 10 with Razor Pages on SQL Server, any competent systems professional can operate and maintain it, not only the person who built it.
Just as important, your data stays yours. You own and control the information the system holds, in a standard, exportable format, so you are never locked in by a closed format or by one individual's knowledge. That is the real protection against key-man risk: not a promise that the expert will stay, but a system that does not need any single person in order to keep running.
What does eliminating key-man dependency actually look like?
PCG runs it in three phases, alongside live operations so nothing stops. The scope and schedule depend on how many dependencies the audit finds and are set during that audit, not promised in advance.
- Dependency auditStructured interviews and observation to map the undocumented processes and rank them by how critical each one is. The output is a written map of where the business currently depends on specific people.
- Logic extraction and system encodingThe knowledge that lives in people and side files is encoded into workflow rules, validations, permissions, and reporting inside the system, running in parallel with live operations so the business keeps working throughout.
- Documentation and handoffPCG delivers the architecture documentation and onboarding your team needs to run the system day to day, and your data stays under your control in a standard format. The knowledge now lives in the system, not in one person.
Find out where your single points of failure are.
Run a 14-day free trial of FireFlight and see how much of your operation's logic a transparent, documented system can hold.
Frequently Asked Questions
1 Uptime Institute, Annual Outage Analysis 2025 (announced May 6, 2025): nearly 40% of organizations reported a major human-error outage in the previous three years, and about 85% of those stemmed from staff not following procedures or from flawed procedures. uptimeinstitute.com
2 Microsoft, ".NET and .NET Core Support Policy": .NET 10 is the current long-term support release (released November 11, 2025; supported through November 14, 2028); .NET 8 reaches end of support on November 10, 2026. dotnet.microsoft.com
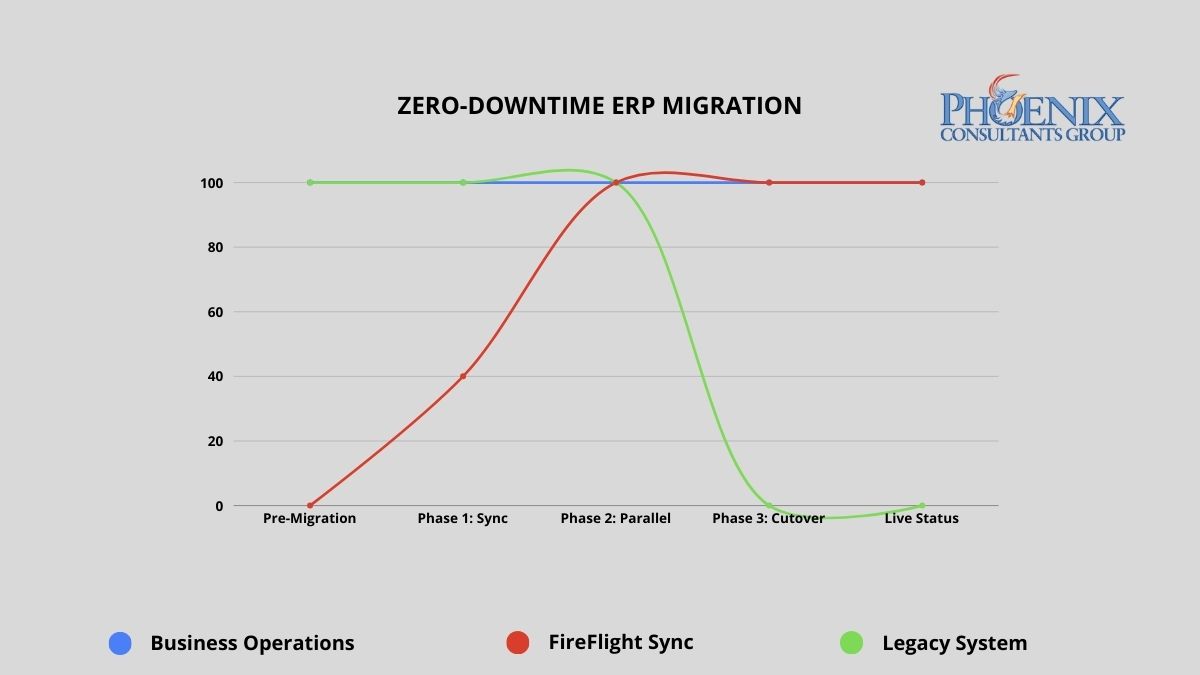
Why do most ERP migrations fail, and why does that fear cause organizations to stay too long?
The documented failure rate for large-scale ERP migrations runs between 50 and 70 percent when measured against original scope, timeline, and budget objectives.2 That number is not a reflection of bad vendors or bad intentions. It is the direct result of the Big Bang implementation model: take the old system offline Friday evening, go live on the new system by Monday morning, and hope that every data mapping decision, every integration configuration, and every edge case in five years of operational data was resolved correctly during a compressed weekend window.
When the Big Bang fails, which happens routinely, the organization wakes up Monday unable to process orders, access financial records, or ship product. Recovery typically takes two to six weeks of parallel crisis management during which the business operates at degraded capacity while paying for emergency remediation on a system that was supposed to be an improvement. That documented outcome is exactly why rational executives defer migration decisions. The fear is not irrational. What most executives do not know is that the Big Bang is not the only methodology available.
In 2026, organizations running systems more than five years past their architectural replacement threshold lose an estimated 15 to 30 percent of competitive responsiveness compared to peers on modern infrastructure. Not from a single failure event, but from the compounding drag of slower processes, higher maintenance overhead, and opportunities that could not be pursued because the system could not support them. The cost of staying is real and measurable. PCG's methodology removes the reason to stay.
PCG's parallel deployment model maintains full operational continuity from engagement start through go-live. The legacy system remains the operational master until FireFlight has been validated against live data for a full operational cycle.
What has changed in ERP migration in 2026?
The industry has moved toward the model PCG has used since 1995, and the 2026 data makes the shift visible.
- Phased and parallel approaches are now the majority preference. A 2026 industry survey found that 58.5 percent of organizations favor phased implementation over Big Bang, a reversal from the all-at-once default that dominated a decade ago.3
- Budget overruns remain the norm on ERP projects, at 64 percent, driven by underestimated staffing (38 percent), scope expansion during implementation (35 percent), and technical issues surfacing late (34 percent).3 A parallel validation window surfaces those issues before they reach a live cutover.
- Cloud ERP migrations now average around 14 months, and legacy or heavily customized applications carry the lowest success rate of any workload category at 61 percent.4 Custom-heavy systems are exactly the case where a validated parallel run matters most.
None of this is a reason to rush. It is a reason to migrate on a model that has already absorbed the risk the 2026 statistics keep measuring. The failure numbers describe Big Bang. They do not describe a parallel deployment that does not go live until the new system is proven against real data.
Big Bang vs. parallel deployment: what does the risk difference actually look like?
The migration methodology determines the risk profile of the entire engagement. Mapped below are the documented outcomes of the traditional Big Bang approach against PCG's parallel deployment model across five critical dimensions.
| Risk dimension | Traditional Big Bang implementation | PCG zero-downtime (FireFlight) |
|---|---|---|
| Operational downtime | 24 to 72+ hours planned; weeks if recovery required | Zero minutes throughout the entire process |
| Data integrity at go-live | Manual reconciliation post-cutover; typical error rate 5-15% | Validated against live data for 30-60 days before cutover |
| Implementation failure rate | 50-70% fail to meet original scope (Standish Group CHAOS Report) | No go-live until both parties confirm accuracy against live data |
| Staff transition pressure | Extreme: single high-stakes cutover with no fallback | Controlled: 30-60 days of real-world experience before cutover |
| Rollback capability | Typically none: legacy system decommissioned at cutover | Full rollback available until both parties validate final cutover |
The failure rate difference is not about PCG's experience relative to other vendors. It is about methodology. Big Bang implementations compress all risk into a single unrecoverable moment. PCG's parallel model distributes risk across a validation period and removes the unrecoverable moment entirely. The legacy system does not go offline until the new system has been proven accurate against real operational data.
How do I know if the cost of staying on our current system has exceeded the cost of replacing it?
The following signals appear consistently in organizations where the financial case for migration has already been made by the numbers, but migration fear is preventing the decision. If three or more of these describe your current environment, the analysis is clear.
- The Maintenance Crossover. Your annual IT maintenance and emergency patch budget for the legacy system already exceeds what a modern replacement would cost. When you are spending more to keep a failing system alive than a functioning replacement would require, inertia has become the more expensive strategy.
- The Revenue Ceiling. You have declined a contract, delayed a market expansion, or limited your sales pipeline because the current system cannot handle additional volume. Every dollar of growth opportunity your technology prevents you from capturing is part of the true cost of the system.
- The Security Gap. Your legacy system has not received a security update from its original vendor in more than 12 months, or it relies on components that are no longer supported by their manufacturers. Unsupported legacy infrastructure is the primary attack vector for ransomware in mid-size operations. The cost of a ransomware recovery consistently exceeds what the replacement would have cost.
- The Vendor Departure. Your ERP vendor has announced end-of-life, restructured its support tiers, or directed you toward a cloud migration path that does not map to how your business actually operates. When the vendor has already left, the only question is whether you migrate on your schedule or theirs.
- The Customization Wall. Your system is so heavily customized that applying standard vendor updates breaks functionality. Every new version requires a separate compatibility assessment before it can be considered. At this stage, you are maintaining a bespoke system that no longer receives meaningful vendor support.
What does zero-downtime migration actually look like in practice?
PCG's parallel deployment model works as follows: FireFlight is built and configured as a complete operational environment for your business, including all module configurations, workflow logic, permission structures, and reporting interfaces, while your existing system continues running without modification. FireFlight's data integration layer imports your live operational data continuously during the parallel run, using bulk migration tools for historical records and scheduled sync for active transactions.
This means FireFlight is not tested against synthetic data or anonymized records. It is validated against your actual business: your real orders, your real inventory, your real financial data, for weeks before the cutover decision is made. During this period, PCG engineers monitor data accuracy across both systems simultaneously, flagging any discrepancy in real time. Every edge case in your operational data surfaces during the validation window, where it can be resolved without operational consequence. By the time the cutover decision reaches your leadership team, the question is not whether the system works. It has already been proven to work.
Data Curation and Foundation Build
PCG extracts your complete data history from the legacy system and performs a full curation: cleaning inconsistent records, resolving duplicates, standardizing formats, and mapping every data element to the FireFlight architecture. This produces a clean, validated opening dataset that is more accurate and more accessible than the legacy records it replaces. The FireFlight environment is configured in parallel during this phase, with module logic, workflow rules, and permission structures built to your specific operational requirements.
Parallel Deployment and Live Validation
FireFlight runs in shadow mode alongside your legacy system, processing the same live operational data and allowing your team to interact with the new environment without it affecting production. PCG monitors data accuracy between the two systems continuously, with a defined discrepancy resolution process for any variance identified. Your team learns the new interface during this phase, with the legacy system available as a reference and fallback. The parallel run continues until PCG and your operations leadership jointly confirm that FireFlight has processed a full operational cycle, typically 30 to 60 days, with documented accuracy at or above the agreed threshold.
Precision Cutover and Post-Go-Live Validation
Once both PCG and your leadership team have confirmed FireFlight's accuracy, the cutover is executed during a scheduled, low-activity window. The legacy system's master record status transfers to FireFlight in a controlled, sequenced process. From that point, the legacy system remains accessible in read-only mode for a defined post-cutover validation period, providing a complete rollback option if any unforeseen issue surfaces in the first days of live operation. In practice, the parallel validation process is thorough enough that post-cutover issues are rare and minor. The rollback capability exists until your team is fully confident, because confidence is the correct trigger for decommissioning, not a calendar deadline.
Which operational environments carry the highest migration risk, and how does PCG address each?
Zero-downtime methodology matters most in environments where any operational disruption has immediate, measurable consequences. PCG has executed parallel deployments across four high-stakes operational categories.
Municipal and Commercial Fleet Operations
Fleet fueling systems, dispatch records, and DOT compliance documentation cannot go offline during migration. PCG delivered a full system replacement for a Top-5 U.S. metropolitan fleet using the parallel deployment model. The client operated on legacy infrastructure through the entire build phase, with the cutover on a Sunday morning and Monday operations running on FireFlight without interruption.
Healthcare Staffing and Credentialing
Scheduling, credentialing, and payroll for multi-facility staffing organizations require accuracy across all three functions simultaneously during any transition period. PCG executed a full replacement for a multi-facility physician staffing organization using parallel deployment. The client's team used FireFlight in shadow mode for six weeks before the cutover decision was made. Zero data loss, and zero post-cutover rollback required.
Environmental Compliance Operations
Air permit tracking, waste manifest records, and remediation documentation must maintain an unbroken audit trail through any system transition. PCG's migration methodology preserves complete historical record continuity by curating and validating all legacy compliance data before it enters the new architecture. The audit trail does not have a gap, and the regulatory record stays complete.
Manufacturing with Active Production Floor
Job costing, inventory, and production scheduling cannot tolerate a migration window that takes the system offline during a production run. PCG's parallel model means the production floor never stops. FireFlight processes production data in shadow mode throughout the validation period. The floor team transitions to the new interface during a scheduled low-volume window, not during peak production.
What has PCG delivered, and in what environments?
Allison Woolbert designed PCG's zero-downtime migration methodology after three decades of managing system transitions in environments where the margin for operational disruption was effectively zero. Her enterprise work includes mission-critical system transitions on projects with corporations such as ExxonMobil, Nabisco, and AXA Financial, where a failed cutover carries direct and measurable business consequences. PCG was founded in 1995. The parallel deployment model has been the foundation of every migration engagement since.
The physician staffing deployment referenced above represents the clearest case study for this methodology in a high-stakes environment, where the client could not stop processing schedules, could not lose credentialing records mid-cycle, and could not delay payroll under any circumstances. PCG ran FireFlight in parallel for six weeks, validated every module against live operational data, and executed the cutover on a Sunday. Every facility was fully operational on FireFlight by Monday. The legacy system was decommissioned the following week after the post-cutover validation confirmed no issues.
If your legacy ERP is a discontinued platform rather than a modern system nearing end of life, the migration path differs, and PCG covers it in migrating off Sage, Great Plains, and Peachtree.
Key takeaways
- Between 50 and 70 percent of large ERP migrations fail against scope, timeline, or budget, and that failure rate is a property of the Big Bang model, not of migration itself.
- PCG's parallel deployment keeps the legacy system as the operational master until FireFlight is validated against live data for 30 to 60 days. The cutover carries zero planned downtime and a full rollback path.
- The 2026 data confirms the shift: 58.5 percent of organizations now prefer phased over Big Bang, while 64 percent of ERP projects still run over budget, most often from scope expansion that a parallel run exposes early.
- Custom-heavy and legacy applications have the lowest cloud-migration success rate at 61 percent, which is exactly the case where a validated parallel run matters most.
- The correct decommission trigger is confirmed performance against real data, not a calendar deadline. PCG has recorded no post-cutover rollbacks across its parallel deployments.
What happens if data discrepancies surface during the parallel validation run?
How long does the full migration take from engagement start to cutover?
Can we actually roll back to the legacy system if something goes wrong after cutover?
What happens to our third-party integrations during the migration?
How does staff training work when the system changes during active operations?
Our current system has years of custom business logic. How does PCG preserve that during migration?
How is our historical data handled? We cannot lose years of operational records.
What is the first step for an organization ready to explore a zero-downtime migration?
Sources
- Zero-downtime migration outcomes based on PCG deployment records across 14 mid-market ERP replacements, 2019-2026. Parallel validation periods ranged from 30 to 68 days across engagements.
- Implementation failure rate data from the Standish Group CHAOS Report, cited across multiple years. Big Bang failure rate estimates based on published industry analysis of enterprise ERP implementation outcomes, 2020-2025.
- DocuClipper, Cloud ERP statistics 2026 (58.5% phased-implementation preference; 64% budget-overrun rate with staffing, scope, and technical drivers), as compiled in 2026 industry reporting.
- 2026 cloud migration statistics: ERP migrations average roughly 14 months; legacy and custom application migrations carry a 61% success rate, the lowest of any workload category.
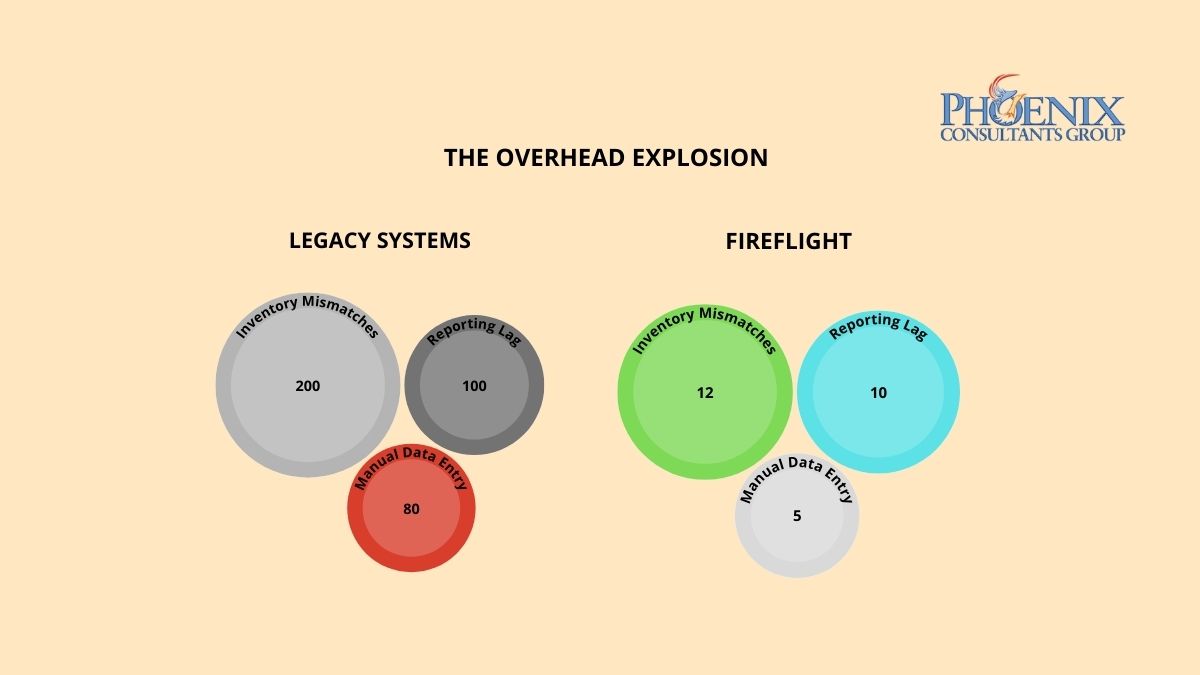
Why do legacy ERP systems fail when a business starts to grow fast?
A monolithic ERP runs everything through one shared codebase, one pool of processing resources, and one set of database connections. That is efficient at a steady size and fragile under growth: as transaction volume climbs, concurrent queries pile onto the same resources, response times stretch, and the system slows sharply before it fails outright. Scaling a monolith to carry several times its original load is like adding floors to a skyscraper on a house foundation. At some point the foundation, not the ambition, sets the limit.
This is not just PCG's view. In February 2026, Gartner noted that many ERP systems of the past earned the label monolithic for their, in its words, infamous inflexibility, and that modern ERP platforms instead embrace low-code flexibility and modular composability, which lets a business add capability far faster than a monolith allows.1 The architectural answer to a growth wall is modular, independently tuned components, not a bigger version of the same block.
How does ERP performance degrade at different growth stages?
The decline is not linear. A monolith holds up near its original size, wobbles when volume doubles, and drops off a cliff somewhere past that, because each increase competes for the same fixed pool of resources. A modular system holds steady because each part is tuned on its own. The pattern looks like this:
| Growth stage | Legacy monolith | Modular platform |
|---|---|---|
| At the original size | Acceptable performance | Tuned baseline |
| Volume doubles | Noticeable lag; time lost to workarounds | Holds steady, no reconfiguration |
| Volume several times over | Frequent timeouts; emergency IT intervention | Holds steady on tuned SQL |
| Volume an order of magnitude over | Critical failure; operations stop | Sustained; modules scale on their own |
The drop from a working system to a failing one usually arrives faster than anyone budgeted for, because the warning signs look like ordinary busy-season slowness right up until they do not.
How do I know if my current ERP has already hit its scalability ceiling?
Three signals tend to show up before the outright failure. Any one is worth watching; together they say the ceiling is close.
The performance lag
The system slows at peak hours, month-end, or high-order periods. That points to a fixed throughput ceiling, not a passing glitch.
The integration struggle
Adding a department or a function takes months of custom work, because in a monolith every change touches the shared core.
The manual backup
You hire extra administrative staff to make up for what the system cannot do. The cost hides in payroll rather than in the technology budget.
See a modular platform hold steady under load.
FireFlight is PCG's configurable platform, built so each module scales on its own. Try it for 14 days, no obligation.
How is FireFlight built differently from the ERP systems that fail under growth?
Generic ERP vendors tend to compete on features and interface design, and rarely publish how their systems behave at high volume. PCG builds for the volume first. FireFlight runs on .NET 10 with Razor Pages over a SQL Server architecture tuned for high-volume concurrent transactions, with database-level compression, query optimization, high-availability hosting, and role-based access down to the field.
Its modules, inventory, scheduling, billing, compliance, and project management, are tuned on their own while sharing one central database, so a new capability is added by extension rather than by replacing the core. And the data under all of it stays yours: you own and control it in a standard, exportable format, not locked inside a closed system. The when growth breaks the business guide covers the operational side of the same inflection point.
What does moving from a legacy ERP to a modular platform look like?
PCG runs the move in three phases, in parallel with the live system so the business keeps operating throughout. The scope and schedule of each phase depend on the current system and the growth ahead, and are set during the load audit rather than promised in advance.
- Load audit and architecture assessmentPCG profiles the current system's performance, maps where its throughput ceiling sits against your growth projections, and produces a prioritized list of constraints and a configuration plan.
- Modular migration and performance tuningBusiness logic moves into modules, SQL tuning is applied at deployment, and the new system runs alongside the live one. Benchmarks are validated against real data before any cutover.
- Growth-ready handoffNew users, departments, transaction types, and modules are added afterward without rebuilds or performance reconfiguration, which is the whole point of moving off the monolith.
Find out where your throughput ceiling sits.
Run a 14-day free trial of FireFlight and see how a modular platform behaves at the volume you are growing into.
Frequently Asked Questions
1 Gartner, press release on embedded AI in cloud ERP applications, February 24, 2026, quoting Mike Helsel, Senior Director, Research, on legacy ERP inflexibility (systems "earned the descriptor monolithic") and modern low-code flexibility and modular composability. gartner.com
2 Microsoft, ".NET and .NET Core Support Policy": .NET 10 is the current long-term support release (released November 11, 2025; supported through November 14, 2028); .NET 8 reaches end of support on November 10, 2026. dotnet.microsoft.com
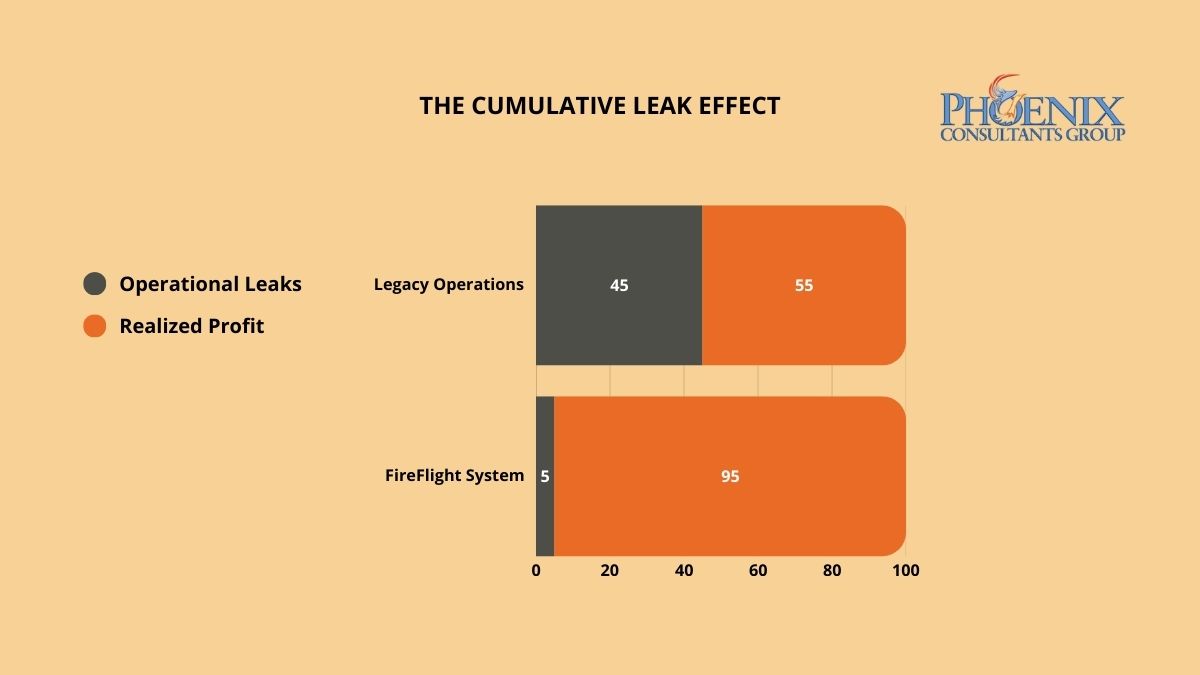
Invisible profit leaks do not appear as single line-item expenses. They accumulate across hundreds of transactions where data moves between disconnected systems and something is dropped, delayed, or never recorded. PCG identifies these hidden loss centers through a forensic Data Integrity Audit, then deploys FireFlight's closed-loop architecture to seal them permanently, so the same categories of loss cannot recur after the system goes live.
Why does margin keep shrinking in businesses where revenue is growing?
Invisible profit leaks are not the result of bad management. They are the structural consequence of fragmented data architecture. When your production floor, warehouse, and accounting department operate on disconnected systems, small discrepancies compound across every transaction cycle. A gap in material waste tracking. A lag in labor capture. A pattern of unrecovered shipping costs. Individually, each sits below the threshold of a typical financial review. Collectively, they represent a consistent, systemic drain on liquidity that no amount of sales growth can fully compensate for.
The core problem is architectural. In a fragmented system, there is no mechanism that closes the loop between what was consumed, what was billed, and what was collected. Transactions flow through the organization across multiple disconnected platforms, and the gaps between those platforms, the moments where data moves from one system to another through a manual step or an informal process, are precisely where the margin disappears. Without a unified framework that tracks every dollar from initial quote to final invoice, the friction tax is not a risk. It is a guarantee.
The pattern has sharpened in 2026. As operations layer AI and automation on top of fragmented data, the friction tax grows rather than shrinks, because automation speeds up whatever the underlying data already does, errors and omissions included. Gartner reported in 2026 that poor data quality or limited data availability is one of the leading direct causes of failed AI projects in infrastructure and operations, the same architectural weakness that generates the friction tax in the first place.1 Faster processing on a leaky architecture moves the bad numbers faster. It does not make them correct.
How do I know if the friction tax is actively running in my organization right now?
Three indicators appear consistently in organizations where the friction tax is active. If two or more apply to your current operation, a formal Data Integrity Audit will identify the specific loss centers and the operational gaps generating each one.
The Growing "Miscellaneous" Category
If your year-end adjustments, write-offs, or "other expense" categories are growing faster than your revenue, you are not dealing with isolated accounting anomalies. You are seeing the aggregate of hundreds of small data gaps that your current system cannot capture or categorize. This is the friction tax made visible only at the point of annual reconciliation, when the financial damage has already been done and the operational window to prevent it has long closed.
The Revenue-Labor Mismatch
If your team is logging more hours and production volume is increasing, but net margin is flat or declining, your system is failing to capture the full cost of production and translate it into billable output. This gap between what was consumed and what was invoiced is one of the most common forms of invisible leakage in service-based and manufacturing operations. It compounds silently across every billing cycle until the annual P&L makes the pattern impossible to ignore.
The Unrecovered Cost Pattern
If your shipping, handling, materials, or subcontractor costs are regularly absorbed rather than passed through to the client invoice, your billing process has a structural gap. These costs do not appear as a single failure. They appear as dozens of small line items that were never triggered because the system did not enforce billing completion as a mandatory step in the transaction close. Each individual instance is small enough to overlook. Across a year of transactions at volume, they represent a predictable and recoverable percentage of revenue.
Why does FireFlight stop profit leaks when other ERP systems cannot?
Generic ERP platforms are designed to be flexible, and that flexibility is precisely what creates the leaks. When a system allows manual overrides, optional fields, and informal data entry pathways, it also allows the errors, omissions, and inconsistencies that generate the friction tax. User-friendly input does not guarantee data-accurate output.
PCG engineers FireFlight as a closed-loop integrity engine. The system enforces hard-coded validation rules at the point of data entry, using real-time field validation and contextual error prevention so data is captured correctly the first time, not corrected manually at month-end. Role-based access controls at the form level and subrecord level mean that users can only interact with data they are authorized to modify, eliminating the informal workarounds that create ghost transactions and untracked consumption.
The SQL Server architecture underlying FireFlight is performance-tuned for high-volume transaction environments, with data compression and audit trail logging built into the core framework. Every material movement, every billable hour, and every shipping event is recorded, timestamped, and traceable from the moment it enters the system. There is no gap between operational reality and financial record. The architecture enforces alignment between the two by design, not by policy.
What does the process of identifying and closing profit leaks with FireFlight actually look like?
PCG conducts a forensic analysis of your last twelve months of transactional data, cross-referencing production records, inventory movements, labor logs, and invoicing cycles to identify the specific points where the numbers stop matching operational reality. This audit produces a complete map of your current friction tax: every loss center, the data gap generating it, and the operational pattern that allows it to recur. The audit is completed before a single line of system configuration is written.
PCG configures the FireFlight system to enforce integrity at each identified loss center, deploying automated validation rules, real-time consumption tracking, mandatory billing triggers for unbilled service events, and inventory reconciliation logic that flags discrepancies before they become write-offs. The system is configured to make the correct data entry path the only available path for each high-risk transaction type. Users cannot skip the step that was previously generating the loss.
Once FireFlight is live, your leadership team gains access to a real-time integrity dashboard that tracks margin recapture against the audit baseline. Monthly financial statements reflect the recaptured liquidity directly, with full traceability to the specific architectural changes that prevented each category of loss. The friction tax does not gradually decline. It stops at the point the closed-loop system goes live.
What experience backs the FireFlight closed-loop integrity model?
PCG developed the Data Integrity Audit methodology because financial clarity cannot be achieved through accounting discipline alone. It requires architectural enforcement. Allison Woolbert built this approach after more than four decades of overseeing complex data systems where untracked consumption and unreconciled transactions carried consequences measured in operational outcomes, not just margin points, including mission-critical data systems built with corporations such as ExxonMobil, Nabisco, and AXA Financial where data accuracy was a non-negotiable operational standard.
That same standard of architectural precision applies to every PCG commercial engagement. In delivering the high-volume fueling system for a Top-5 U.S. metro fleet, an environment where every gallon dispensed must be tracked, authorized, and reconciled against a financial record in real time, PCG engineered the closed-loop integrity model that now underpins the FireFlight system. Zero untracked consumption. Zero reconciliation gaps. Zero friction tax.
Frequently Asked Questions
1 Gartner, press release: "Gartner Says AI Projects in Infrastructure and Operations Stall Ahead of Meaningful ROI Returns," which cites poor data quality or limited data availability as a leading direct cause of AI project failure, April 7, 2026. gartner.com
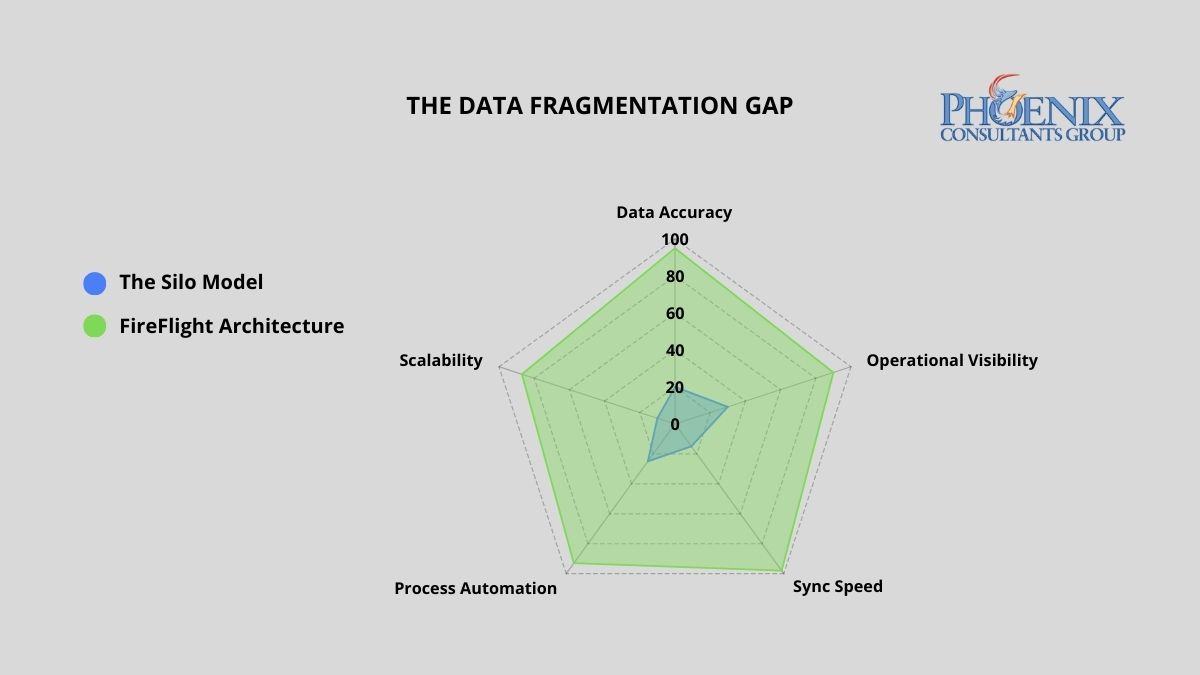
FireFlight's unified architecture outperforms the fragmented data silo model across every operational dimension. The gap widens as transaction volume and department count increase, because fragmentation compounds while unification does not.
Why do data silos keep forming even in well-managed organizations?
Data fragmentation rarely happens by design. It is the byproduct of rapid growth. As companies scale, each department purchases the tool that solves its immediate problem: the sales team adopts a CRM, the warehouse selects a standalone inventory tracker, and accounting continues with a legacy ledger system. These tools were engineered to serve individual functions, not to share a common data language.
The result is a growing network of information islands where data is trapped within the department that collected it. By the time leadership reconciles those islands into a coherent picture, often days or weeks after the fact, the operational window to act has already closed. In high-margin or high-volume environments, this lag is not a minor inconvenience. It is a structural tax on every business decision made from incomplete information.
What has changed about the cost of data silos in 2026?
The operational costs described in this guide have not gone away. What changed in 2026 is that a second, larger cost sits on top of them: fragmented data is now the single biggest thing standing between a business and any working use of AI.
- 95 percent of IT leaders now name integration issues, not algorithms and not compute, as the primary barrier to adopting AI.3 The bottleneck is getting the right data to the right place, which is exactly the problem silos create.
- Poor data quality and siloed architecture cost organizations an estimated 12.9 to 15 million dollars per year, according to 2026 Gartner and IBM benchmarks.4
- Roughly 71 percent of business applications remain disconnected, and close to 80 percent of enterprise AI initiatives fail to scale because their data is trapped across fragmented systems.3
The practical consequence for an executive in 2026: an AI tool can only reason over the data it can see. When orders live in one system, inventory in another, and financials in a third, the AI sees fragments and produces fragmented answers. A unified data core is not a nice-to-have for an AI strategy. It is the precondition.
What does departmental data fragmentation actually cost per year?
Disconnected systems impose a compounding cost on accuracy, productivity, and margin. The table below quantifies the financial and operational exposure of running fragmented architecture versus a unified FireFlight deployment.2
| Business function | Weekly data friction (hours) | Annual margin risk (revenue %) |
|---|---|---|
| Sales vs. Warehouse: Selling non-existent stock | 12-18 hrs | 4%-6% |
| Warehouse vs. Accounting: Unrecorded waste and shrinkage | 10-14 hrs | 3%-5% |
| Accounting vs. Sales: Inaccurate commission and tax reporting | 8-12 hrs | 2%-4% |
| Manual Month-End Reconciliation (all departments) | 10-16 hrs | N/A |
| FireFlight Unified System: Automated cross-sync | < 2 hrs | < 0.5% |
A unified FireFlight deployment recaptures this lost productivity by making any change in one department, a closed sale, an inventory adjustment, a payment received, propagate instantly across all others, with no reconciliation, no lag, and no version conflict between what sales closed and what accounting recorded.
How do I know if my organization already has a data silo problem?
Three diagnostic markers indicate active data fragmentation. If two or more apply to your organization, the system is generating compounding costs that will scale with your growth, not shrink.
The "Which Version" Question
If the first ten minutes of your leadership meetings are spent determining which department has the correct numbers, your architecture has already failed. Conflicting reports are not a personnel issue. They are a symptom of disconnected databases producing independent versions of operational reality, none of which can be trusted without cross-referencing the others.
The Manual Pivot Table
If your accounting team merges spreadsheets from three different systems to close the month, you are paying for human reconciliation instead of financial strategy. That manual process is your highest-risk point for compounding errors: a formula off by one row, a filter applied incorrectly, a column that did not export cleanly. Each one invisible until the audit finds it.
The Customer Contradiction
If a client receives a shipping confirmation that contradicts the invoice they just paid, your internal fragmentation has become visible to the market. Operational de-sync at this level is a brand liability, not just an accounting problem. It is the point at which the cost of disconnected systems stops being internal and starts being reputational.
Why do integration tools fail to actually solve the data silo problem?
Most software vendors sell integrations as a feature. In practice, these are API bridges built on top of two separate databases: brittle connectors that break on the first version update and require manual maintenance every time either system changes. This is not unification. It is the same fragmentation problem with an extra layer of failure points added on top.
PCG takes a fundamentally different approach. FireFlight is a modular development system built in .NET Core 8 with Razor Pages, engineered to consolidate multi-departmental business logic into a single SQL Server database from the ground up. Every module, from inventory control and scheduling to billing, compliance tracking, and project management, shares the same data core. There is no inter-system translation layer, and no reconciliation job running at midnight. When a salesperson closes a deal, the warehouse sees the inventory move and accounting records the revenue in the same transaction, instantly.
Because FireFlight is a configurable system rather than a rigid off-the-shelf product, PCG deploys bespoke interfaces for each department tailored to their specific workflows, permissions, and reporting needs, while all interfaces read from and write to the same centralized source of truth. Each department gets an experience designed for their function. The data underneath is always the same number. Where a full replacement is not the right first step, the same principle can be reached through data movement and middleware integration that connects systems that were not designed to talk.
What does the process of unifying disconnected systems into FireFlight actually look like?
Silo Mapping
PCG conducts a full audit of your current data architecture, identifying every isolated data pocket, every manual workaround, and every point where departments are operating from conflicting information. This diagnostic phase defines the full scope of the migration before a single line of code is written. The output is a complete map of your current fragmentation and a prioritized consolidation plan based on where the highest friction costs are concentrated.
Parallel Deployment
The FireFlight system is deployed and validated alongside your existing systems. During this phase, PCG migrates your historical data, configures department-specific modules, and runs both architectures simultaneously to validate accuracy. Your operations never stop. Each department's live data is validated against the FireFlight output in real time before the transition is declared complete, so leadership can confirm accuracy before committing to the cutover.
The Clean Cutover
Once FireFlight has been validated against live operational data, the legacy systems are retired. Leadership gains a single real-time command dashboard reflecting the complete health of the business: sales pipeline, inventory position, and financial performance, without departmental distortion or manual aggregation. Month-end close that previously required 10 to 16 hours of reconciliation work is replaced by a dashboard review that takes minutes.
What experience backs the FireFlight unified data architecture?
PCG built FireFlight because generic software was failing the clients who needed architectural integrity most. Allison Woolbert developed the foundational framework over more than four decades of work on mission-critical data systems, including projects with corporations such as ExxonMobil, Nabisco, and AXA Financial, where information de-sync between operational units was not an option.
That same architectural discipline applies to every FireFlight deployment. PCG has delivered unified data systems across sectors where fragmentation carries real operational risk: municipal fleet management for Top-5 U.S. metro areas, ground support equipment tracking for airport operations, and multi-facility scheduling and credentialing systems for physician staffing organizations. In each case, the work was not to connect existing tools. It was to replace the fragmented architecture with a single authoritative system. The same fragmentation shows up acutely when a business depends on spreadsheets, a pattern covered in the spreadsheet trap and the manual workaround tax.
Key takeaways
- Data silos cost the average mid-size operation 40 or more staff hours per week in reconciliation and erode 9 to 15 percent of annual revenue in reporting and inventory errors.
- In 2026 a second cost sits on top: 95 percent of IT leaders name integration issues, not algorithms, as the primary barrier to AI adoption, and poor data quality costs organizations an estimated 12.9 to 15 million dollars a year.
- Integration tools are API bridges on top of separate databases that break on version updates. They add failure points rather than removing fragmentation.
- FireFlight consolidates every department into a single SQL Server core, so a closed sale, an inventory move, and a recorded payment happen in one transaction with no reconciliation job.
- A unified data core is the precondition for any AI initiative, because an AI tool can only reason over the data it can actually see.
How long does a full migration to FireFlight actually take?
Can we keep some of our existing tools and still achieve a unified source of truth?
Does centralizing data into one system create a single point of failure?
What is the measurable ROI of moving to a unified data system?
Do individual departments lose flexibility when everything moves to one system?
What does data silo fragmentation actually cost per year?
How is FireFlight different from buying an integration tool that connects our existing systems?
Why do data silos block AI adoption?
Sources
- Manual reconciliation labor estimates and margin erosion figures derived from PCG Data Integrity Audit assessments conducted across 9 mid-market multi-department operations, 2020-2025, and the Optifai Sales Ops Benchmark Report 2025 (N=687 companies).
- Departmental friction hours derived from PCG client pre-deployment assessments; annual margin risk percentages sourced from Aberdeen Group Data Quality Research 2024.
- 2026 data integration statistics: 95% of IT leaders cite integration as the primary AI-adoption barrier (Salesforce); ~71% of business applications remain disconnected; close to 80% of enterprise AI initiatives fail to scale due to fragmented data. Compiled via Peliqan and Integrate.io 2026 reporting.
- Gartner and IBM 2026 benchmarks on the annual cost of poor data quality and siloed architecture (estimated 12.9 to 15 million dollars per organization).
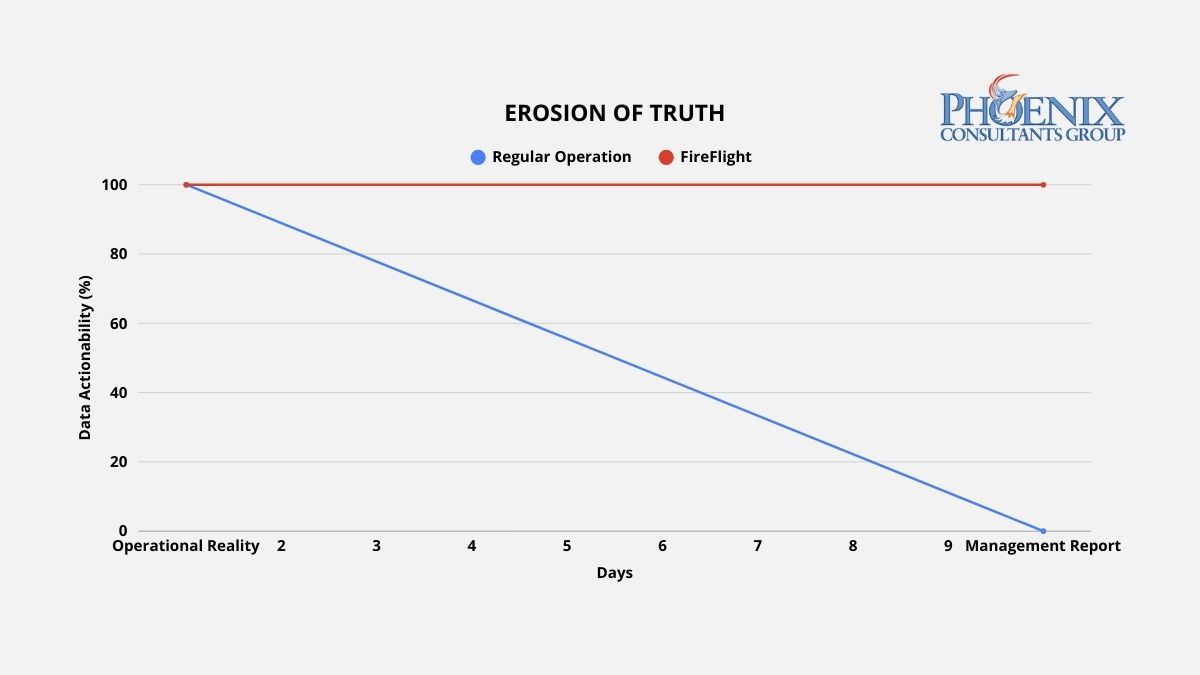
Data actionability drops sharply within 48 hours of a reporting cycle in standard ERP environments. FireFlight's live architecture holds actionability constant because the data never ages out of relevance.
Why do traditional reports always arrive 10 days late?
Reporting lag is the technical byproduct of a system architecture built around data storage rather than data flow. In a conventional ERP environment, data is generated at the operational level, a sale is logged, a production event is recorded, an inventory movement is entered, and then sits in that system's database until a human exports it, cleans it, reformats it, and assembles it into a report. That process typically runs one to three days for routine reports, and up to a week for cross-departmental analysis that requires merging data from multiple systems.
Each step in that manual assembly introduces two compounding problems. The first is delay: by the time the report is ready, the operational window it describes has already closed. Then comes distortion, because every reformatting step is an opportunity for a formula error, a mismatched join, or a filtered row that quietly warps what leadership actually sees. High-performance operations do not produce better reports. They eliminate the manual assembly process entirely by replacing static data storage with a live data engine that delivers current information directly to the decision-maker without human intervention.
Why is real-time data the precondition for using AI in 2026?
The reporting-lag problem got more expensive in 2026, because the same stale data that misleads a leadership team also cripples any AI initiative built on top of it. An AI model is only as current as the data feeding it, and a model reasoning about a 10-day-old version of the business produces recommendations that arrive after the window to act on them has closed.
- Roughly 80 percent of organizations still rely on stale data for decision-making, and 85 percent of data leaders say decisions made on outdated data have directly cost their companies money.2
- About 75 percent of AI analytics projects fail to scale past the pilot stage, most often because of data fragmentation and integration gaps rather than the model itself.3
- Companies that pair AI with real-time data are roughly five times more likely to improve decision speed and operational efficiency than those running on batch-cycle reporting.3
The practical order of operations for 2026: the live data engine comes first, the AI comes second. An organization that fixes its reporting lag is not just making better decisions this quarter. It is building the current, unified data foundation that any AI tool needs before it can produce anything a leadership team should trust.
What does reporting latency actually do to operational decisions?
Reporting latency does not affect all decisions equally, but it affects every decision. The table below maps the operational consequences of three data latency states against weekly staff time consumed and the type of decisions each state produces.1
| Data latency state | Weekly hours in report prep | Decision basis | Decision impact |
|---|---|---|---|
| 7+ Day Lag: Manual / Fragmented ERP | 15-25 hrs | Historical trends. Decisions arrive after the corrective window closes. | Fully reactive. Leadership explains last week's problems instead of preventing this week's. |
| 24-Hour Delay: Standard ERP with Nightly Sync | 5-10 hrs | Yesterday's performance. Corrective, but not proactive. | Corrective. Problems are caught after they occur, not before they compound. |
| FireFlight: Live 60-Second Data Engine | Under 1 hr | Current operational reality. Decisions made at the moment of variance. | Proactive. Variances are visible while corrective action is still low-cost. |
The shift from corrective to proactive is the structural value of real-time architecture. A 24-hour delay lets you respond to yesterday's problems. Anything past a week forces you to explain last week's problems to a leadership team that needed to act on them five days ago. FireFlight puts data in front of decision-makers when a variance occurs, when corrective action is still low-cost and high-impact, not after the damage is already compounding.
How do I know if my reporting architecture has already failed?
Three operational patterns indicate active reporting lag. Each one represents wasted capacity and delayed decision-making that grows more expensive as the organization grows.
The Export Culture
Your managers cannot answer a basic question about current profitability, production status, or inventory position without clicking "Export to Excel" and building a pivot table. If extracting data from your system requires a manual step before it becomes useful information, the architecture has separated data from intelligence. The export is not a feature. It is evidence that the system does not deliver insights automatically, and the cost of that manual step compounds every day it continues.
The Report Preparation Sink
Your team spends two or more hours preparing data before a weekly leadership meeting. That time is not analysis. It is assembly: the manual labor of moving data from where it lives to where it needs to be read, reformatting it along the way. In a 50-person operation where three or four staff members are involved in report preparation, that represents 300 to 600 hours of productive capacity lost per year to a process that an automated data architecture eliminates entirely.1
The Conflicting Versions Problem
Two departments arrive at the same meeting with different numbers for the same metric. Both are correct for their system, on the date their system last updated. Neither is current. When each department produces its own version of operational reality, leadership cannot make decisions because it cannot determine which version to trust. Real-time architecture does not produce versions. It produces one current truth, visible to every authorized user simultaneously. This is the same fragmentation covered in the hidden cost of data silos.
How does FireFlight actually eliminate the lag, not just reduce it?
Most ERP vendors offer dashboards as a presentation layer bolted onto a static database. The visual design may be sophisticated. If the underlying data updates on a nightly batch job, the dashboard is showing yesterday's operational state with today's color scheme. Cosmetic improvement on a structural problem does not fix the structure.
PCG engineers FireFlight as a live data engine where the database and every authorized interface maintain continuous synchronization. The moment an operational event is recorded, a sale closed, a material consumed, a job completed, an invoice generated, that event propagates through the FireFlight architecture in real time. Every relevant metric, every connected module, and every dashboard view that references it updates immediately, with no batch job, no reconciliation window, and no version lag between what happened and what leadership sees.
FireFlight's reporting architecture provides three distinct dashboard models, each suited to a different decision-making context. Custom dashboards are configured to the specific KPIs your leadership team uses to run the business. Ad-hoc dashboards are assembled from custom SQL queries for advanced users who need on-demand visibility into specific data sets. User-personalized dashboards allow individual managers to configure their own views from a library of approved queries, with permission-based visibility controls that limit each user to the data relevant to their role. All three pull from the same live database, so every view reflects the same current operational reality regardless of who configured it.
What does the process of eliminating reporting lag actually look like?
Data Stream Identification
PCG maps every point in your current operational flow where data is generated, where it gets delayed, and where it requires manual intervention before it becomes useful information. This includes every export step, every manual merge, every scheduled batch job, and every informal process where staff members serve as data conduits between disconnected systems. The output is a complete inventory of your current reporting friction, ranked by the volume of staff time consumed and the decision latency each bottleneck introduces.
Live System Integration
PCG deploys the FireFlight data engine to intercept data streams at their point of origin, replacing manual export and reconciliation steps with automated, real-time data flow into the unified FireFlight database. Each dashboard is configured to the specific KPIs identified in the stream mapping phase. The deployment runs in parallel with your existing reporting process, the same zero-downtime parallel method PCG uses for full ERP replacement, so your leadership team can validate FireFlight's live data against the manual reports they currently rely on before the transition is complete.
The Operational Command View
Once FireFlight is live, your leadership team gains a real-time operational dashboard providing current visibility into every metric that currently requires a manual report: revenue pipeline, production status, inventory position, labor utilization, billing cycle. All updated continuously without staff intervention. The weekly report preparation meeting is replaced by a standing dashboard review where decisions are made on current data. Staff hours previously spent on report preparation are redirected to the analysis and action those reports were supposed to enable.
What experience backs the FireFlight live data architecture?
PCG built FireFlight's live data architecture because the clients who needed real-time intelligence most were precisely the ones whose existing systems were most deeply committed to batch-cycle reporting. Allison Woolbert developed the continuous data flow methodology after three decades of engineering systems for environments where a 24-hour reporting lag carries operational consequences, including data frameworks for the United States Air Force where decision latency is measured in minutes, not days.
That same standard applies to every PCG commercial deployment, informed by work with corporations such as ExxonMobil, Nabisco, and AXA Financial where the cost of delayed operational data is measured directly. In the end-to-end scheduling, credentialing, and payroll system PCG built for a multi-facility physician staffing organization, an environment where staffing decisions affect patient care continuity, regulatory compliance, and revenue recognition simultaneously, PCG built a live intelligence architecture that gives operations leadership current visibility into every facility's staffing status, credential compliance position, and payroll cycle in a single dashboard view, with no exports, no manual merges, and no lag between operational reality and the data used to manage it.
Key takeaways
- A reporting lag of a week or more means every major decision runs on data that no longer describes the business, turning leadership reactive by design.
- The lag is architectural, not a discipline problem: it comes from systems built around data storage and manual export rather than continuous data flow.
- In 2026 the lag also blocks AI: about 80 percent of organizations still decide on stale data, and roughly 75 percent of AI analytics projects fail to scale past pilots because of fragmented, delayed data.
- FireFlight is a live data engine, not a dashboard bolted onto a nightly batch job. Operational events propagate to every view in real time, with no reconciliation window.
- PCG deploys the live engine in parallel with existing reports and validates against them, so the switch to real-time data carries no gap in reporting.
How difficult is it to configure FireFlight dashboards for our specific KPIs?
Does real-time data processing slow down our operational system?
How do we know real-time data is accurate and not just fast?
Can we control which executives and managers see which data in the live dashboard?
What happens to our existing reports during the transition to FireFlight?
What is the real operational impact of a 10-day reporting lag?
How long does it take to eliminate reporting lag with FireFlight?
Why does reporting lag block AI adoption in 2026?
Sources
- Weekly staff hour estimates based on PCG client pre-deployment assessments conducted across 14 mid-market ERP environments, 2022-2025.
- IBM, "The real cost of delayed data" (2026): 80% of organizations still rely on stale data for decision-making; 85% of data leaders say decisions on outdated data have directly cost their companies money. ibm.com
- 2026 analytics research: roughly 75% of AI analytics projects fail to scale past pilot stage due to data fragmentation and integration; McKinsey finding that AI paired with real-time data makes organizations about 5x more likely to improve decision speed and efficiency.
Why does ghost stock keep appearing in systems that are updated regularly?
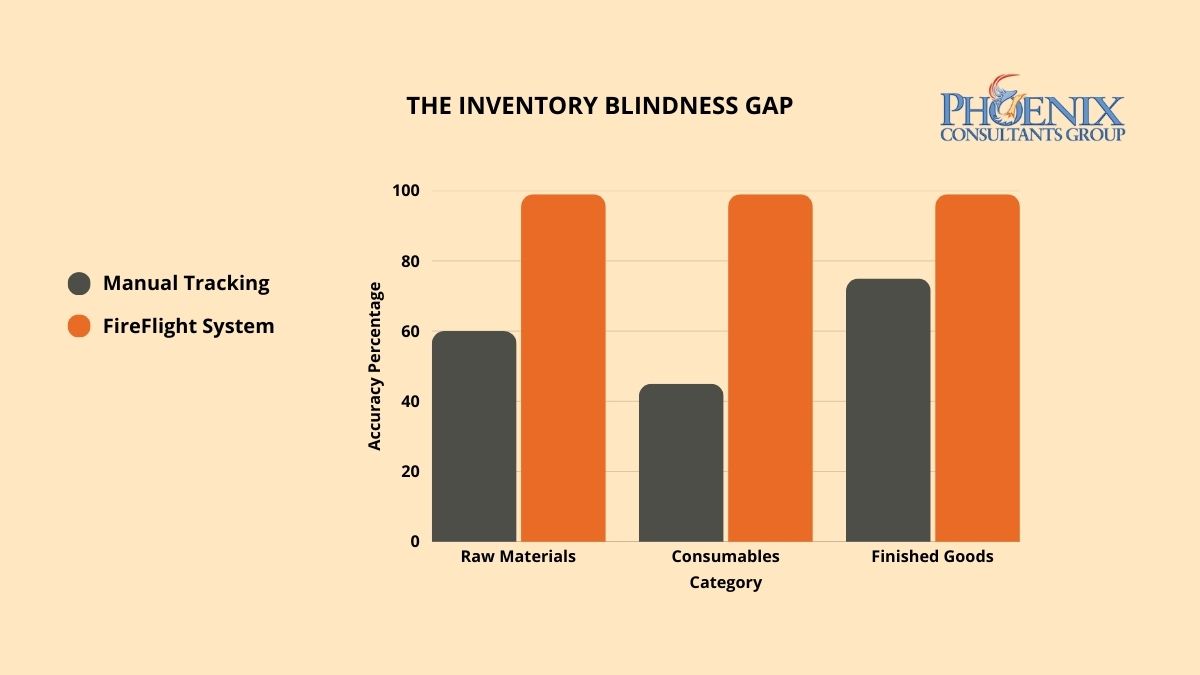
Ghost stock is inventory the system still counts but the shelf no longer holds. It appears whenever the record is disconnected from the actual consumption events: a partial use, a remainder set aside, a return that never gets logged. Batch updates at the end of a shift, a day, or a month miss all of these, so a small variance opens up and then compounds. It starts as a minor gap, grows into a real one, and purchasers respond the only way they safely can, by overbuying buffer stock. Capital ties up in material nobody needs, and production still stops the day the true shortage is discovered.
In 2026 this carries a cost beyond the floor. Inaccurate inventory is a data-quality failure, and Gartner named poor data quality a leading direct cause of failed AI and analytics work this year.1 A business that cannot trust its stock numbers cannot build reliable forecasting, automated reordering, or AI on top of them, so the ghost-stock problem quietly caps everything it might do with its own data.
What does inventory inaccuracy actually do to operations?
The damage tracks how closely the record follows real consumption. The three states below describe where most operations sit.
| Tracking state | Time lost to reconciliation | Production downtime risk |
|---|---|---|
| Blind: manual counts or spreadsheets | High. Staff hours go to counting and chasing variances. | High. Several unplanned stops a month. |
| Standard: partial ERP, periodic counts | Moderate. Reconciliation at intervals, not at the transaction. | Moderate. Occasional stops between counts. |
| Real-time: consumption captured as it happens | Minimal. The record updates with the movement. | Low. Reorder points trigger before depletion. |
The move from the standard state to real-time is not an incremental gain. It closes the loop at the transaction level rather than at reconciliation, which is a different thing entirely: the gap never gets a chance to open, instead of being found and corrected after it already has.
How do I know if inventory blindness is costing my operation right now?
Three patterns show the problem is structural rather than occasional. Any one is worth watching; together they point to an architecture that cannot keep up.
The just-in-case overbuy
Buffer orders that reflect distrust of the system. Across the operation, that safety buying routinely costs more than fixing the root problem would.
The emergency production stop
An unplanned stop costs idle labor, expedited procurement, and a disrupted schedule. More than one a quarter is architectural, not bad luck.
The year-end write-off
The physical-count adjustment measures the gap between the system and reality. If it grows year over year, the errors are compounding, and counting more often will not fix it.
See inventory that updates with the work, not after it.
FireFlight is PCG's configurable platform, with real-time consumption tracking built in. Try it for 14 days, no obligation.
Why do scanners and barcode systems alone not solve the inventory accuracy problem?
A scanner captures data. It does not, on its own, decide what that data means for the rest of the operation. The accuracy comes from what happens after the scan. Fed into the right system, a single scan updates the database, logs the production, adjusts quantities against the open job's bill of materials, recalculates the reorder point from current lead times, and raises a procurement alert, all in one transaction, as it happens.
That is the difference between capturing a number and keeping the record true. PCG's inventory module handles partial quantities, off-cuts, and returns, reconciles planned against actual consumption continuously, and runs on a SQL Server back end built to keep up with the many material movements a busy shift generates. The hidden cost of data silos covers the wider version of the same disconnect.
What does fixing inventory accuracy with FireFlight actually look like?
PCG runs it in three steps, alongside the existing process so the floor keeps moving. The scope and schedule depend on the operation and are set during the first step, not promised in advance.
- Material flow auditPCG maps material from receiving through to finished goods, classifies where the record and the reality diverge, and produces the data model the system will run on.
- Consumption logic integrationPCG configures the bill-of-materials, job-consumption, and lead-time rules, migrates and reconciles the historical data to an accurate baseline, and runs in parallel with the existing process before any cutover.
- Automated procurement handoffProcurement shifts to management by exception: the system generates purchase orders at the reorder thresholds and adjusts those thresholds as lead times change, so buyers act on exceptions rather than re-checking everything by hand.
Find out how wide your inventory gap really is.
Run a 14-day free trial of FireFlight and see what real-time consumption tracking does to the daily count.
Frequently Asked Questions
1 Gartner, press release citing poor data quality or limited data availability as a leading direct cause of failed AI projects, April 7, 2026. gartner.com
2 Operational time-loss patterns reflect PCG material-flow audit assessments across manufacturing operations, consistent with industry distribution-center benchmarking by the Warehousing Education and Research Council (WERC).