10-Day Reporting Lag: What It Costs, Why It Happens, and How to Eliminate It
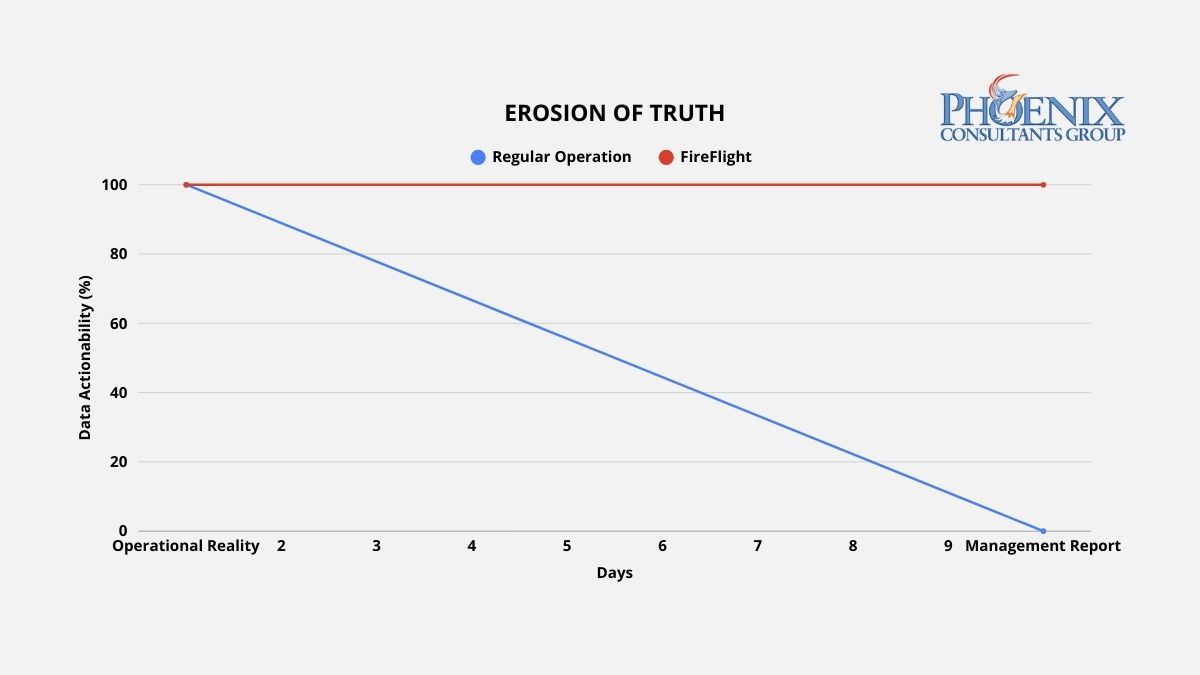
Your Q3 margin report lands on Thursday. It covers data through last Friday. By the time your leadership team reviews it, discusses it, and decides on a response, you are acting on information that is ten to fourteen days old in an operational environment that changes daily or hourly. The margin graph you are responding to this week started two weeks ago. The production bottleneck you are addressing today was visible in the data before it became a problem. You just did not have access to the data at the moment it mattered.
This is reporting lag and it is not a minor inconvenience. For a mid-size operation processing $10 million in annual revenue, a consistent 10-day decision delay translates to between $300,000 and $1.5 million in annual margin exposure: variance corrections that arrive too late to prevent, procurement decisions made without current inventory data, and staffing adjustments triggered by last week’s numbers in this week’s operational reality. The cost is not in the report itself. It is in every decision that was made while the accurate data sat unprocessed in a fragmented system. Phoenix Consultants Group eliminates reporting lag at the architectural level by deploying the FireFlight Data System a live intelligence engine that delivers current operational data to every authorized decision-maker, updated to the last 60 seconds, without a single manual export step.
Why Do Traditional Reports Always Arrive Late?
Reporting lag is the technical byproduct of a system architecture built around data storage rather than data flow. In a conventional ERP environment, data is generated at the operational level a sale is logged, a production event is recorded, an inventory movement is entered and then sits in that system’s database until a human exports it, cleans it, reformats it, and assembles it into a report. That process takes time: typically one to three days for routine reports, and up to a week for cross-departmental analysis that requires merging data from multiple systems.
Each step in that manual assembly process introduces two compounding problems: delay and error. The delay is obvious by the time the report is ready, the operational window it describes has closed. The error is less visible but equally damaging: every manual reformatting step is an opportunity for a formula mistake, a mismatched join, or a filtered row that distorts the picture the report is supposed to provide. High-performance organizations do not produce better reports. They eliminate the manual assembly process entirely by replacing static data storage with a live data engine that delivers accurate, current information directly to the dashboard without human intervention.
The Decision Velocity Matrix: The Cost of Reporting Latency
Reporting latency does not affect all decisions equally but it affects every decision. The following table maps the operational and financial consequences of three data latency states against weekly staff time and annual margin exposure.
Data Latency State | Weekly Friction (Hours in Manual Report Prep) | Decision Basis | Annual Margin Risk |
7+ Day Lag – Manual / Fragmented ERP | 15 – 25 hrs | Historical trends – decisions arrive after the window | 10% – 15% (fully reactive) |
24-Hour Delay -Standard ERP with Nightly Sync | 5 – 10 hrs | Yesterday’s performance – corrective but not proactive | 3% – 5% (corrective) |
FireFlight Real-Time – Live 60-Second Data Engine | < 1 hr | Current operational reality – decisions made at the moment of variance | < 1% (proactive) |
The shift from corrective to proactive is the fundamental value of real-time architecture. A 24-hour delay allows you to respond to yesterday’s problems. A 7-day delay forces you to explain last week’s problems. FireFlight puts the data in front of decision-makers at the moment a variance occurs, when corrective action is still low-cost and high-impact, not after the damage is already compounding.
The Strategic Friction Audit: Three Signs Your Reporting Architecture Has Failed
These three operational patterns indicate active reporting lag. Each one represents a category of wasted capacity and delayed decision-making that compounds with organizational size the larger your operation, the more expensive the lag.
- The Export Culture: Your managers cannot answer a basic question about current profitability, production status, or inventory position without clicking ‘Export to Excel’ and building a pivot table. If extracting data from your system requires a manual step before it becomes useful information, your architecture has separated data from intelligence. The export is not a feature it is evidence that the system does not do the job of delivering insights automatically.
- The Report Preparation Sink: Your team spends two or more hours preparing data before a weekly leadership meeting. That time is not analysis it is assembly. It is the manual labor of moving data from where it lives to where it needs to be read, reformatting it along the way. In a 50-person operation where three or four staff members are involved in report preparation, that represents 300 to 600 hours of productive capacity lost per year to a process that an automated data architecture eliminates entirely.
- The Conflicting Versions Problem: Two departments arrive at the same meeting with different numbers for the same metric. Both are right for their system, on the date their system last updated. Neither is current. This is the reporting equivalent of the data silo problem: when each department produces its own version of operational reality, leadership cannot make decisions because it cannot determine which version to trust. Real-time architecture does not produce versions it produces one current truth, visible to every authorized user simultaneously.
Architecture Over Features: The Live Intelligence Engine
Most ERP vendors offer dashboards as a presentation layer bolted onto a static database. The visual design may be sophisticated, but if the underlying data updates on a nightly batch job, the dashboard is showing you yesterday’s operational state with today’s color scheme. Cosmetic improvement on a structural problem is not a solution.
Phoenix Consultants Group engineers FireFlight as a live data engine where the database and every authorized interface maintain continuous synchronization. The moment an operational event is recorded a sale closed, a material consumed, a job completed, an invoice generated that event propagates through the FireFlight architecture in real time, updating every relevant metric, every connected module, and every dashboard view that references it. There is no batch job. There is no reconciliation window. There is no version lag between what happened and what leadership sees.
FireFlight’s reporting architecture provides dashboard models, each designed for a different decision-making context. Custom dashboards are built using the system reporting module and delivered per client specification configured to the exact KPIs and operational metrics your leadership team uses to run the business. Ad-hoc dashboards are assembled from custom SQL queries for advanced users who need on-demand visibility into specific data sets. User-personalized dashboards allow individual managers to configure their own views from a library of approved queries, with permission-based visibility controls that ensure each user sees only the data relevant to their role and authorization level. All three models pull from the same live database so every view, regardless of who configured it, reflects the same current operational reality.
The Continuity Roadmap: From Delayed Reporting to Live Intelligence
Most ERP vendors offer dashboards as a presentation layer bolted onto a static database. The visual design may be sophisticated, but if the underlying data updates on a nightly batch job, the dashboard is showing you yesterday’s operational state with today’s color scheme. Cosmetic improvement on a structural problem is not a solution.
Phoenix Consultants Group engineers FireFlight as a live data engine where the database and every authorized interface maintain continuous synchronization. The moment an operational event is recorded a sale closed, a material consumed, a job completed, an invoice generated that event propagates through the FireFlight architecture in real time, updating every relevant metric, every connected module, and every dashboard view that references it. There is no batch job. There is no reconciliation window. There is no version lag between what happened and what leadership sees.
FireFlight’s reporting architecture provides dashboard models, each designed for a different decision-making context. Custom dashboards are built using the system reporting module and delivered per client specification configured to the exact KPIs and operational metrics your leadership team uses to run the business. Ad-hoc dashboards are assembled from custom SQL queries for advanced users who need on-demand visibility into specific data sets. User-personalized dashboards allow individual managers to configure their own views from a library of approved queries, with permission-based visibility controls that ensure each user sees only the data relevant to their role and authorization level. All three models pull from the same live database so every view, regardless of who configured it, reflects the same current operational reality.
- Data Stream Identification: PCG maps every point in your current operational flow where data is generated, where it gets delayed, and where it requires manual intervention before it becomes useful information. This includes every export step, every manual merge, every scheduled batch job, and every informal process where staff members serve as data conduits between disconnected systems. The output of this phase is a complete inventory of your current reporting friction ranked by the volume of staff time consumed and the decision latency each bottleneck introduces.
- Live System Integration: PCG deploys the FireFlight data engine to intercept data streams at their point of origin replacing manual export and reconciliation steps with automated, real-time data flow into the unified FireFlight database. Each dashboard is configured to the specific KPIs and reporting requirements identified in the stream mapping phase. The deployment runs in parallel with your existing reporting process, so your leadership team can validate the accuracy of FireFlight’s live data against the manual reports they currently rely on before the transition is complete.
- The Operational Command View: Once FireFlight is live, your leadership team gains a bespoke command interface: a real-time operational dashboard that provides current visibility into every metric that currently requires a manual report revenue pipeline, production status, inventory position, labor utilization, billing cycle updated continuously without staff intervention. The weekly report preparation meeting is replaced by a standing dashboard review where decisions are made on current data, not assembled history. The staff hours previously spent on report preparation are redirected to the analysis and action those reports were supposed to enable.
Evidence of Experience: Built for Real-Time Decision Environments
PCG built FireFlight’s live data architecture because the clients who needed real-time intelligence most were precisely the ones whose existing systems were most deeply committed to batch-cycle reporting. Allison Woolbert developed the system continuous data flow methodology after three decades of engineering systems for environments where a 24-hour reporting lag carries operational consequences including enterprise intelligence systems for ExxonMobil, Nabisco, and AXA Financial where decision latency carries direct revenue consequences..
That same standard of real-time data availability is applied to PCG’s commercial deployments. In delivering the end-to-end scheduling, credentialing, and payroll system for a multi-facility physician staffing organization an environment where staffing decisions affect patient care continuity, regulatory compliance, and revenue recognition simultaneously PCG built a live intelligence architecture that gives operations leadership current visibility into every facility’s staffing status, credential compliance position, and payroll cycle in a single dashboard view. No exports. No manual merges. No lag between operational reality and the data used to manage it.
Authority FAQ: C-Level Objections, Answered Directly
How difficult is it to configure the dashboards for our specific metrics?
FireFlight’s dashboard configuration is designed to be handled by PCG during the deployment phase, based on the KPI and reporting requirements identified in the stream mapping audit. Your leadership team specifies the metrics that matter revenue by product line, production throughput by shift, inventory turn by category and PCG configures the live views accordingly. For advanced users who need on-demand access to custom data sets, the ad-hoc query interface allows direct SQL-based dashboard construction without requiring a development cycle for every new reporting need.
Does real-time data processing slow down the operational system’s performance?
No. FireFlight’s SQL Server architecture is performance-tuned specifically for high-frequency, concurrent transaction environments. The system uses data compression and query optimization at the database level to maintain sub-second response times across all connected modules and dashboard views, even under high transaction volume. Real-time data delivery and system performance are not in tension in the FireFlight architecture the infrastructure is engineered to handle both simultaneously.
How do we ensure that real-time data is accurate not just fast?
Speed without accuracy is not intelligence it is noise delivered faster. FireFlight enforces data accuracy at the point of entry through real-time field validation, mandatory field logic, and role-based input controls that prevent incorrect data from entering the system in the first place. The live dashboard reflects accurate operational data because the architecture enforces data quality upstream, before the record is committed. This is the core distinction between a live database and a live reporting layer on top of a flawed database FireFlight is the former.
Can we control which members of leadership see which data in the live dashboard?
Yes, with granular precision. FireFlight’s permission system operates at the dashboard level, the query level, and the field level so each user’s view is limited to the data their role and authorization level permit them to access. A regional operations manager sees current data for their facilities. A CFO sees consolidated financial metrics across all operations. A production supervisor sees shop-floor throughput and inventory status for their line. The same live database serves all of them simultaneously, with each view filtered by a permission architecture that is configured during deployment and maintained by your designated system administrator.
What happens to our existing reports and reporting workflows during the transition?
Your existing reports remain operational throughout the transition period. PCG’s deployment methodology runs FireFlight in parallel with your current reporting process your team continues producing and using their existing reports while PCG configures and validates the live dashboard equivalents. The transition to FireFlight reporting happens incrementally, report by report, as each live view is validated against the manual report it replaces. By the time the final cutover occurs, your leadership team has already been using and trusting the live data for weeks.
About the Author
Allison Woolbert: CEO & Senior Systems Architect, Phoenix Consultants Group
Allison brings over 40 years of expertise in database architecture, enterprise system design, and custom software development. She has spent four decades solving the hardest data problems in business working with Fortune 500 corporations, growing mid-size firms, and small businesses across industries ranging from manufacturing and fleet management to healthcare staffing and regulatory compliance. FireFlight Data System is the product of everything she learned: a purpose-built engine designed to eliminate the structural failures she encountered and fixed throughout her career.