When the source code for business software is lost, the cost falls into four categories that compound over time: operational disruption when the system finally fails, the migration premium paid for emergency timelines, business continuity exposure during unplanned downtime, and the long-term erosion of institutional knowledge. Total financial impact depends on how long the exposure remains unaddressed.

Source code loss rarely arrives as a single event. It accumulates quietly across years of staff turnover, vendor transitions, lost backup tapes, and undocumented contractor work. By the time a CFO becomes aware of the exposure, the business is often already running production software that nobody on the current team can modify, audit, or recover from a major failure. This article presents a financial framework for evaluating that exposure before the system fails, when the cost of action is still controllable.
Phoenix Consultants Group has been recovering orphaned business software since 1995, across more than 500 production engagements covering Microsoft Access, Visual FoxPro, Visual Basic 6, Delphi, PowerBuilder, and early .NET applications.1 The categories below come from that engagement history and reflect the financial patterns CFOs encounter when source code recovery becomes urgent rather than planned. This framework is platform-agnostic, so the financial mechanics apply equally to any custom business software in production.
What does "source code is lost" actually mean for a business in 2026?
Source code loss is a spectrum, not a single condition. A CFO assessing exposure should understand which point on the spectrum applies to the business, because the financial implications differ at each point. Four scenarios recur across PCG engagements, ordered from least to most severe.
Source code exists, knowledge does not
The source files are accessible on company servers, but nobody on staff or in any active vendor relationship can productively read them. Financial exposure: moderate, recoverable through a documented application audit.
Source code exists, location is unknown
The source files were preserved somewhere by a former developer or vendor, but the current team cannot locate them. Financial exposure: elevated, requires source recovery work before assessment is possible.
Partial source code only
Some source files are recoverable but others are missing, often the most recently modified ones. Financial exposure: high, requires reconstruction of missing components alongside recovered material.
Compiled application only
Only the executable and the database remain. No source files can be located anywhere. Financial exposure: highest, requires reverse-engineering from the compiled application and the data structure.
The framework that follows applies across all four scenarios. Cost mechanics, however, scale with severity. A CFO who identifies the scenario early has significantly more options than a CFO who discovers the exposure during a production failure. Early identification preserves the planning window in which exposure can be quantified, recovery can be scoped, and budget allocation can occur on a deliberate schedule.2
What is the cost of operational disruption when the software finally fails?
The first cost category is operational disruption. Line items appear immediately and continue accruing until the business resumes normal operations. CFOs typically focus on direct staff productivity loss, which is the most visible component, but operational disruption includes several other measurable expenses that surface only after the failure begins.
Staff productivity loss is the headline figure. When the system that runs accounting, inventory, customer records, or compliance reporting becomes unavailable, the staff who depended on it cannot perform their normal work. Some shift to manual workarounds using spreadsheets and paper forms. Others wait. The cost is the fully-loaded labor expense for the affected staff during the entire disruption window, less any productive work they manage to complete through alternative means.
Customer-facing impact follows quickly when the affected software touches the customer experience. Order intake delayed by manual workarounds. Customer service responses extended because the agent cannot look up account history. Invoices delayed because the billing system is the affected platform. Each touchpoint absorbs a measurable cost in delayed revenue, customer service overhead, and reputational impact that compounds across the disruption window.
Downstream system failures are the cost category most often underestimated. Modern business software rarely operates in isolation. The affected application typically feeds data to accounting, reporting, regulatory submission, or partner integration platforms. When the source system fails, the downstream systems begin producing stale or incomplete output. The cost is the staff time required to identify, correct, and restore confidence in every downstream data flow after the source system returns.2
How does emergency-timeline migration cost compare to planned migration?
The second cost category is the emergency migration premium. A migration triggered by a production failure runs on whatever schedule the broken business can survive, against whatever vendor the business can engage on short notice, with whatever scope the business can articulate during emergency conditions. Each of those constraints translates into measurable additional cost compared to a planned migration of the same application.
Timeline compression is the largest premium driver. A planned migration spreads discovery, design, build, and cutover across a comfortable window that allows for testing, validation, and operational learning. An emergency migration compresses the same work into whatever window the business can survive without the original software. Compression typically requires additional engineering hours to maintain quality under reduced timeline, premium rates for accelerated turnaround, and additional risk reserves to handle issues that surface late in the compressed schedule.
Vendor selection power disappears when the business is in emergency mode. A planned migration allows the CFO to evaluate multiple vendor proposals, negotiate scope, and select the engagement that produces the best long-term value. An emergency migration eliminates that negotiating position. The business engages whichever qualified vendor can start immediately, at whatever rate that vendor proposes, with whatever scope the vendor is willing to commit to under the time constraint. Price differences between selected-vendor and available-vendor often exceed the difference between planned-timeline and emergency-timeline considered alone.
Scope inflation is the third driver. A planned migration begins with a documented source application inventory that defines exactly what must be replicated in the destination system. An emergency migration begins without that inventory, because the business has not had time to build it. The vendor is forced to estimate scope against incomplete information, which produces either an inflated estimate to cover unknowns or an underscoped commitment that requires expensive change orders during execution. Either outcome costs more than a planned migration with documented scope.3
The emergency premium is not a small percentage adjustment. Across PCG engagements, an emergency migration consistently costs significantly more than the same scope executed on a planned timeline, before counting the operational disruption cost incurred during the emergency window. The decision to delay assessment is the decision to pay the premium.
What is the business continuity exposure during unplanned downtime?
The third cost category is business continuity exposure during the downtime window itself. Operational disruption captures the staff and customer impact. Business continuity exposure captures the broader financial risks that surface when revenue, compliance, or regulatory obligations depend on the affected software.
Revenue at risk is the most measurable component. When the affected software is part of the revenue process, every hour of downtime carries a quantifiable opportunity cost. Manufacturing operations that cannot produce. Service businesses that cannot bill. Retail operations that cannot transact. The cost is the gross revenue normally generated during the affected window, less whatever portion the business successfully recovers through workarounds or post-recovery batch processing.
Compliance and regulatory exposure carries the highest tail risk. Industries operating under regulatory schedules, such as environmental remediation, OSHA reporting, ISO 9000 documentation, or industry-specific compliance frameworks, face penalty exposure when the supporting software fails during a reporting window. The cost includes any penalties assessed, the staff time required to demonstrate good-faith compliance during recovery, and in severe cases the cost of external counsel or regulatory negotiation.4
Audit failure is the related risk that surfaces during external review rather than regulatory deadline. A financial audit, a quality systems audit, an insurance audit, or a customer audit conducted while the affected software is unavailable produces findings that can extend significantly beyond the original audit scope. Auditors who encounter undocumented systems often expand the scope of their review to validate adjacent business processes, which carries its own cost in staff time and potential remediation findings.
What is the long-term cost of lost institutional knowledge?
The fourth cost category is institutional knowledge erosion. This category accrues continuously, not at the point of system failure, which makes it the easiest cost to underestimate in advance and the most disruptive cost to address after the fact. Three components compose institutional knowledge erosion.
Undocumented business rules are the first component. Custom business software accumulates rules over years of development: pricing calculations, approval workflows, validation logic, regulatory mappings, and workflow conditionals that reflect how the business actually operates. When the original developer leaves and the source code is lost, those rules exist only inside the compiled application. The business operates on rules nobody on staff can articulate, which means decisions that depend on those rules cannot be reviewed, updated, or audited without rebuilding the rule logic from scratch.
Training cost is the second component. New staff who join the team after the institutional knowledge is lost must learn the system entirely from its observable behavior, without access to documentation that explains why the system behaves as it does. Onboarding timelines extend accordingly. The risk of staff making decisions based on incorrect mental models of the software increases. Each new hire carries a higher onboarding cost than they would in an organization with documented systems.
Decision lag is the third component, and the one most directly measurable in CFO terms. When a business question depends on understanding what the software actually does, and nobody on staff can answer the question definitively, decisions either delay until investigation completes or proceed against incomplete information. Both outcomes carry cost. Pricing decisions made on misunderstood logic. Capacity planning based on incorrect assumptions about system limits. Compliance reporting that cannot be defended under audit because the underlying calculations cannot be explained.2
Speak directly with the engineer who would scope your exposure assessment
A free 30-minute consultation to evaluate which of the four cost categories apply to your situation. No obligation, no sales handoff.
What hidden financial risks do CFOs underestimate?
Beyond the four primary cost categories, three secondary risks recur across CFO engagements. Each one is invisible until it triggers, and each one can equal or exceed the primary cost categories in financial impact when it surfaces.
The first hidden risk is integration cascade failure. Affected software typically connects to other systems through APIs, scheduled data transfers, or shared databases. When the affected software fails, the integration connections fail with it. Each connected system then begins producing incorrect output, missing updates, or accumulating queued transactions that cannot process. The cost of restoring confidence in every downstream system after the primary failure resolves often exceeds the cost of the primary recovery itself.
The second hidden risk is vendor concentration. CFOs who have not assessed source code exposure often discover that a single former vendor or contractor was responsible for multiple business-critical applications. When one of those applications fails and recovery is needed, the same exposure profile applies to every other application that vendor built. A single recovery engagement may surface the need for parallel recoveries across the rest of the portfolio, each carrying its own cost.
The third hidden risk is talent market exposure. Pools of developers qualified to work on legacy platforms shrink every year. CFOs who plan to address source code exposure "eventually" face a continuously degrading talent market for the platforms in question. The same recovery engagement scoped today costs more next year, and significantly more in five years, simply because the developer talent capable of executing it becomes scarcer over time.1
How can a CFO quantify exposure before the system fails?
The exposure assessment is a defined engagement, not an open-ended investigation. PCG performs source code and application inventory assessments designed specifically to produce a CFO-grade financial exposure document. Each deliverable is a written report mapping operational functions to the cost categories described above, with the exposure level identified for each function.
Assessment phase work typically completes in 2 to 4 weeks for a mid-sized business application. PCG works against copies of the source code, the compiled application, and the production database. Production systems continue operating normally throughout the assessment. The deliverable stands on its own as a planning document, regardless of whether the business subsequently chooses to proceed with source recovery, migration, or continued operation under the existing application.3
Without an exposure assessment
CFO operates on assumption
- Total financial exposure unknown
- Cost categories not separated by operational function
- Vendor concentration risk undocumented
- Recovery cost can only be estimated after system failure
- Budget planning happens reactively, under timeline pressure
- Compliance and audit exposure unquantified
After the exposure assessment
CFO has a planning document
- Written exposure profile organized by business function
- Cost categories quantified for the specific application
- Vendor concentration risk mapped across the portfolio
- Recovery engagement scope and timeline documented
- Budget allocation can happen on a planned schedule
- Compliance and audit exposure included in the assessment
A planned exposure assessment costs measurably less than the operational disruption of a single production failure. CFOs who have completed the assessment own a planning document the business uses regardless of next steps.
PCG's exposure assessment connects naturally to subsequent engagements when the business chooses to proceed. Recovery work begins with the inventory already in hand. Migration scoping begins with the financial categories already documented. A continued-operation path also becomes possible because the business now has the documentation it never previously had. The assessment is the foundation, not a commitment to any particular next step.1
Quantify your source code exposure before the system fails
A free 30-minute consultation, followed by a fixed-fee exposure assessment if it is the right next step.
The system works until a Windows update, a server replacement, or a compliance audit forces the issue. By the point of failure, the CFO has no control over timeline, vendor selection, or scope. Financial exposure is highest when the business is forced to act under emergency conditions. CFOs who assess exposure before the system fails preserve the option to act on a planned schedule, which materially reduces total cost.
PCG performs a source code and application inventory engagement that produces a written assessment of what exists, what is recoverable, and what is at risk. The deliverable includes an exposure profile organized by business function, so the CFO can match financial risk to operational dependency. The engagement does not require migration commitment. The assessment stands on its own as a planning document.
The classification depends on the scope. A pure assessment and inventory engagement is typically an operational expense. A full source recovery followed by migration produces a new application asset that qualifies for capital treatment under standard accounting practice. PCG provides documentation suitable for either treatment and recommends consulting with the business accounting team on classification specific to the engagement.
A developer being unreachable means the knowledge in their head is gone, but the source code may still exist on company servers or backup media. Source code loss is more severe: the source files themselves cannot be located, and only the compiled application remains. Both situations are recoverable through PCG's discovery process, but source code loss extends the timeline and requires more reverse-engineering work to reconstruct the business logic.
The exposure assessment phase typically completes in 2 to 4 weeks for a mid-sized business application. The deliverable is a written report mapping each operational function to its associated financial risk if the supporting software fails. The assessment runs independently from any subsequent recovery or migration engagement. The CFO ends the assessment owning a planning document the business can use regardless of next steps.
1 Phoenix Consultants Group, My Developer Disappeared: What Do I Do? phxconsultants.com
2 Phoenix Consultants Group, Visual FoxPro Rescue When Your Developer Is Gone. phxconsultants.com
3 Phoenix Consultants Group, Conversion, Migration and Integration service page. phxconsultants.com
4 Phoenix Consultants Group, True Cost of Technical Debt: An Executive Guide. phxconsultants.com
This article is informational and reflects PCG's experience executing source code recoveries and orphaned system rescues since 1995. It is not legal, regulatory, financial, or accounting advice for any specific situation. CFOs should consult with their accounting team on expense classification and with legal counsel on contractual matters specific to their business. For guidance tailored to a particular source code exposure assessment, contact Phoenix Consultants Group directly.

There is a specific kind of message that stops a leader cold.“Hey, do you have a few minutes today? I’ve got some news.”You already know what comes next. Your developer, the one whose name comes up every time someone says “we should ask before touching that,” is leaving.New offer. Burnout. Career change. The reason does […]
When a business doubles in revenue but its systems stay the same, the CEO stops leading and starts firefighting. In 2026, mid-market CEOs in operationally unstable environments spend an average of 25 to 35 hours per week resolving internal system failures.1 That is not a management problem. It is an architectural one. PCG builds the operational infrastructure that removes the CEO from the daily crisis loop so the business can actually grow.
Why does growth create chaos instead of momentum?
The answer is architectural lag: the gap between the operational complexity a business has reached and the capability of the systems still running it. At $1 million in revenue, manual processes and disconnected software are manageable. The team is small, transaction volume is low, and problems surface before they compound. At $5 million, those same processes become bottlenecks. At $10 million, they become the primary constraint on further growth.
Every manual reconciliation step is now a daily friction point. Every disconnected system is a source of conflicting data. Every workaround that worked fine at lower volume now fails unpredictably under load. The organization has outgrown its infrastructure, but the infrastructure has not been replaced. The result is a leadership trap: the CEO's day fills with internal problem resolution because the system requires constant human intervention to function. Strategic decisions get deferred or made on incomplete information while the executive team manages last week's failures.
This is the condition PCG resolves. Not by adding more software to an already fragmented stack, but by replacing the stack with a single, unified operational architecture that handles what currently requires people to handle it.
Leadership bandwidth consumed by operational firefighting drops sharply once the system eliminates the intervention points that generate fires. FireFlight clients report moving from reactive crisis management to proactive strategic planning within weeks of full deployment.
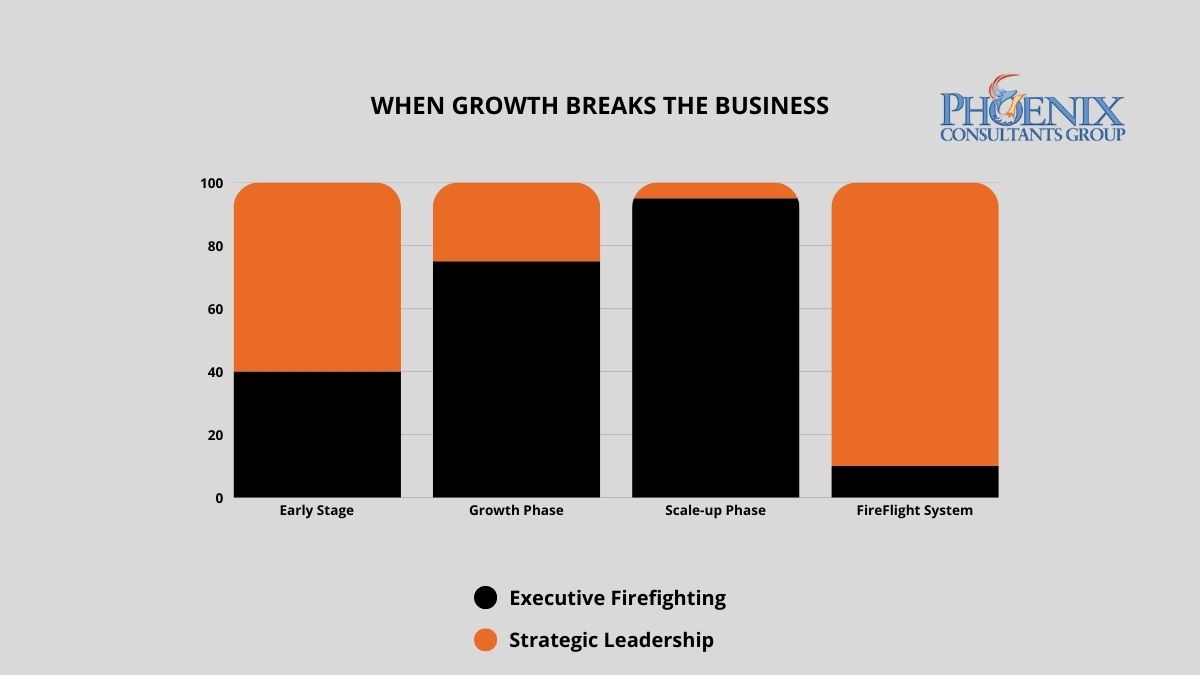
What does the cost of architectural lag actually look like at the leadership level?
Operational chaos does not just consume time. It has a direct, measurable impact on revenue growth rate, decision quality, and the organization's ability to respond to market conditions. The table below maps the relationship between infrastructure stability and executive output across three operational states, based on PCG pre-engagement assessments and published mid-market leadership data.2
| Operational State | Weekly Crisis Hours (Leadership) | Annual Revenue Growth Rate | Strategic Decision Capacity |
|---|---|---|---|
| Chaos: Legacy or manual infrastructure | 25-35 hrs/week | 0-5% (stagnant) | Under 20% of executive bandwidth |
| Reactive: Patchwork or partial ERP | 12-20 hrs/week | 5-12% (friction-constrained) | Around 40% of executive bandwidth |
| Strategic: FireFlight unified architecture | Under 3 hrs/week | Unconstrained by infrastructure | Over 80% of executive bandwidth |
FireFlight does not reduce the number of fires. It eliminates the conditions that generate them. Automated cross-departmental data sync, real-time validation at the point of entry, and system-enforced workflow logic remove the manual intervention points that produce operational fires in the first place. The CEO is no longer the error-correction mechanism of last resort. The architecture handles that function.
How do I know if the chaos is coming from my systems or my team?
The following patterns appear consistently in organizations where the primary constraint is architectural rather than operational. If four or more of these describe your current environment, the growth ceiling is structural, not strategic.
- The Morning Fire. Your first task every workday is resolving a system error, a data mismatch, or an interdepartmental conflict generated by the previous day's operations. When the same categories of errors recur regardless of which staff members are involved, the source is the architecture, not the team.
- The Expansion Hold. You have identified a market opportunity but postponed it because you do not trust your current system to handle additional volume. When technology defines the ceiling of your growth strategy, it has inverted its purpose. A system should expand your capacity, not set its limit.
- The Visibility Gap. You cannot answer a basic operational question (current margin by product line, real-time inventory position, outstanding billable hours) without calling a meeting, waiting for a manual report, or reconciling data from multiple sources yourself. Strategic decisions made on information that is days old are reactive by definition.
- The Single-System Dependency. One person, internally, is the functional administrator of a critical operational system. Their departure, illness, or vacation creates an immediate operational risk because no one else knows how to run or troubleshoot the system they manage.
- The Reconciliation Meeting. Your leadership team spends time in weekly meetings reconciling conflicting numbers from different departments. Both sets of numbers are accurate for the system that generated them. Neither reflects current operational reality. The conflict is not between the departments. It is between disconnected data sources.
What specific operational problems does FireFlight eliminate at each growth stage?
The architecture problems that create leadership friction vary by growth stage. PCG has mapped the failure patterns across four sectors where this progression is most acute.
Manufacturing and Industrial Operations
Production floor data, job costing, and multi-location inventory are the first functions to break as volume grows. Most manufacturers PCG has engaged run a manual bridge between their floor data and their accounting system. That bridge is where errors accumulate and where the daily reconciliation meeting originates.
Environmental and Compliance Operations
Air permit tracking, waste manifest documentation, and inspection records require audit trails that hold regulatory scrutiny. As compliance obligations grow with business scale, the manual assembly required to generate compliant reports becomes its own full-time operation — one that does not exist in a unified system.
Healthcare Staffing and Multi-Site Operations
Scheduling, credentialing, and payroll for multi-facility organizations require real-time accuracy across all three simultaneously. Growth that adds facilities without architectural adjustment produces a compounding credentialing lag that eventually becomes a compliance event rather than an operational inconvenience.
Fleet and Field Service Operations
Dispatch, compliance documentation, and billing for field service teams require data that flows from the field to the back office without manual transfer steps. Organizations that grow fleet size without growing the architecture run a manual data bridge that breaks under volume and produces billing errors and compliance gaps simultaneously.
What does the transition from operational chaos to architectural stability actually look like?
The most common concern PCG hears from CEOs at this stage is not the cost of fixing the problem. It is the fear that fixing it will create a new crisis in the process. PCG's three-phase methodology is built around that constraint. The business does not stop at any point during the transition.
System Stress Test
PCG maps every point in your current operational flow where manual intervention is required, every system that produces conflicting data, and every process that depends on a specific individual rather than an automated rule. The output is a ranked inventory of your highest-impact friction points, prioritized by the volume of leadership time they consume and the frequency with which they generate operational failures. This phase does not touch your current systems. It is a diagnostic, not a deployment.
Architectural Harmonization
PCG deploys FireFlight as the unified operational core, migrating your existing data streams and configuring automated sync, validation, and reporting logic for each identified friction point. The deployment runs entirely in parallel with your live operations. Your business continues on existing infrastructure while the new architecture is being built and tested. Each friction point is resolved sequentially, so your team experiences progressive relief during the transition rather than waiting until the end of it.
Strategic Handoff
Once FireFlight is fully operational, your leadership team transitions to a management-by-exception model. The system flags anomalies and exceptions automatically. Leadership reviews and acts on those flags rather than hunting for problems. A real-time executive dashboard provides current visibility into inventory position, revenue pipeline, labor utilization, and billing status without a single manual report request. The fires stop. The strategic agenda resumes.
What has PCG actually built, and for whom?
Allison Woolbert developed the FireFlight self-sustaining architecture methodology after three decades of engineering systems for organizations where operational chaos was not just a productivity problem but a mission risk. Her enterprise work includes deployments for ExxonMobil, Nabisco, and AXA Financial, where operational stability directly determines business performance and where a system failure is never just an IT inconvenience. PCG was founded in 1995.
That same standard is applied to every PCG commercial engagement. When a Top-5 U.S. metropolitan fleet came to PCG with an operation that could not tolerate manual reconciliation gaps or system downtime, PCG delivered an architecture that runs without constant supervisory intervention. The operational team manages by exception. The system manages itself. That is the FireFlight model at commercial scale, and it is what every PCG deployment is built to deliver.
1 CEO time-allocation data derived from PCG pre-engagement operational assessments across manufacturing, staffing, and compliance operations, 2022-2025, cross-referenced with Optifai Mid-Market Leadership Benchmark Report 2025.
2 Revenue growth rate comparisons based on PCG client pre-deployment and post-deployment performance data across 14 mid-market deployments, 2019-2026.
Frequently Asked Questions
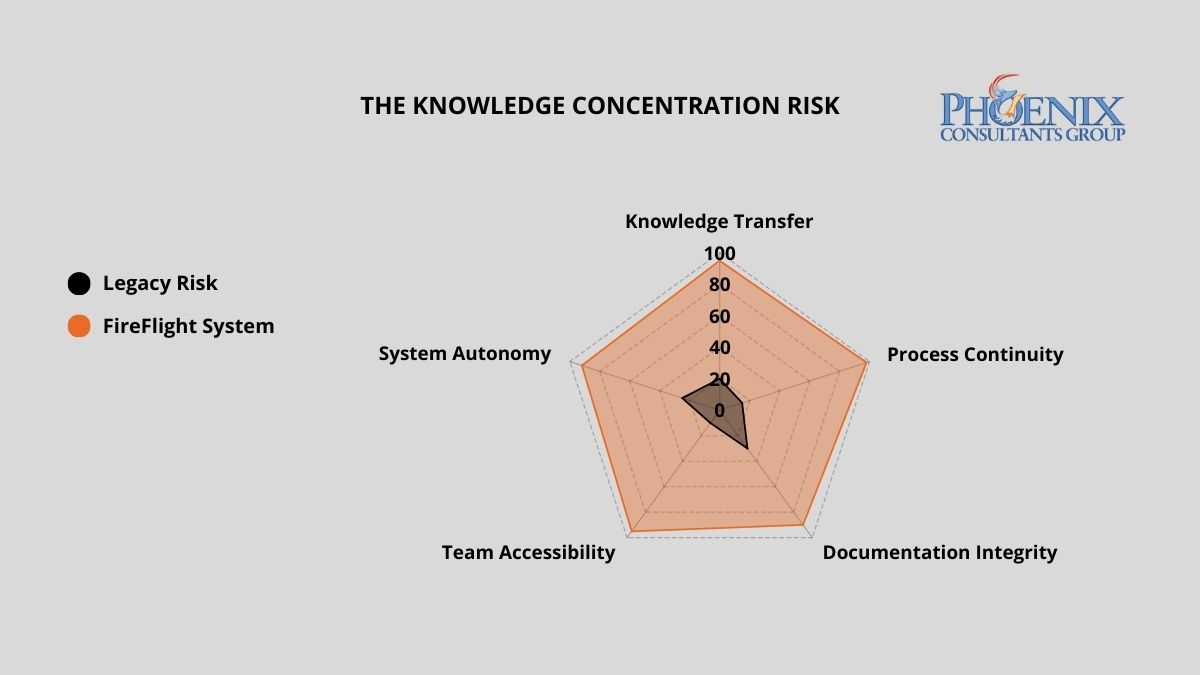
Unplanned IT downtime costs mid-size organizations between $5,000 and $9,000 per hour when the one person who understands the system is unavailable.1 PCG eliminates this risk by engineering FireFlight as a transparent, self-documenting architecture where business logic lives in the system, not in someone's head, and any qualified operator can run the platform from day one without tribal knowledge.
Why do organizations end up with systems only one person can operate?
The Expert Trap is almost never intentional. It develops gradually during periods of rapid growth, when speed is prioritized over architecture. A developer builds a workaround to solve an urgent problem. A power user creates a macro that automates a manual process. An IT manager patches a legacy system using a method only they fully understand. Each of these decisions makes sense in the moment. Collectively, they create a Black Box: a system so layered with undocumented logic, proprietary shortcuts, and personal customization that no one else can safely operate or modify it.
Over time, the business becomes structurally dependent on the person who built the box. IT leadership cannot modify the system without consulting them. Finance cannot run a custom report without their help. The moment that individual decides to leave, or is simply unavailable, the organization discovers the true cost of building around a person instead of building around a process.
What does key-man dependency actually cost when it becomes a real incident?
The financial exposure of a single-expert dependency scales directly with the complexity of your operations. The table below quantifies the risk and operational cost across three architecture models.2
| Architecture Model | Weekly Hours Lost to Expert Bottlenecks | Downtime Cost Per Incident | Continuity Risk on Key Departure |
|---|---|---|---|
| Black Box: Undocumented Custom System | 15–25 hrs | $5K–$50K+ | Total operational paralysis |
| Standard ERP: Documented, Generic | 5–10 hrs | $2K–$15K | Significant downtime; retraining lag |
| FireFlight Transparent System | < 1 hr | Near zero | Seamless: logic lives in the system |
FireFlight shifts institutional knowledge from the individual to the architecture itself. Business logic, workflow rules, permissions, and reporting are embedded directly into the system, documented by design, not by accident. Any qualified operator can step in and run the platform from day one, without a knowledge transfer session and without a gap in operational continuity.
How do I know if my organization is already inside the Expert Trap?
Three markers indicate active key-man dependency. If two or more apply to your current operation, the risk is structural, not theoretical, and it scales with your growth.
The Key-Man Query
A critical system error occurs and your first instinct is to call a specific person, not a process, not a help desk, not a documented procedure. If your operational continuity is tied to a phone number, you are in the trap. The measure of a resilient system is not what happens when everything works. It is what happens when something breaks and the expert is on a plane.
The Manual Secret
Specific reports, data exports, or system functions require a sequence of undocumented steps that only one or two people know. When those people are unavailable, the function stops. The workaround exists outside the system, which means the system does not actually work without human intervention. Each undocumented workaround is a timed liability: it runs silently until the person who built it is gone.
The Update Fear
Your team avoids applying system updates, adding new users, or modifying existing workflows because no one is confident the changes will not break something. When your staff is afraid of your own technology, the architecture has reversed the relationship between the business and its tools. The system is running the organization rather than serving it.
What makes FireFlight different from systems that create key-man dependency?
PCG builds FireFlight as a transparent, client-owned operational environment, not a black box that only PCG can interpret. Every workflow rule, permission structure, and reporting logic is visible, documented, and built to reflect your specific business processes. Your team understands what the system does and why it does it.
That transparency is not a risk to PCG's business model. It is the foundation of it. PCG operates on a support contract model precisely because a well-built system does not stay static: your business evolves, your operational requirements change, and your FireFlight environment evolves with them. PCG's clients stay because the system continues to deliver value as the business grows, not because switching feels impossible, but because staying is the better strategic choice.
The underlying architecture, .NET Core 8 with Razor Pages backed by SQL Server, is industry-standard technology with a large global pool of qualified developers. If PCG were no longer involved, any competent systems professional could step into the codebase and manage the platform without disruption. That is not a hypothetical guarantee. It is an architectural fact built into every deployment.
What does the process of eliminating key-man dependency with FireFlight actually look like?
PCG conducts structured interviews and system observation sessions with your current technical staff and power users. Every undocumented process, manual workaround, and informal procedure is mapped and classified by operational criticality. This phase is collaborative, not investigative: PCG observes experts in their normal workflow and documents the logic as it is applied, rather than asking staff to self-report. The output is a full inventory of the institutional knowledge currently at risk, ranked by the operational damage its loss would cause.
PCG engineers extract that tribal knowledge and encode it directly into the FireFlight system as automated workflow rules, system-enforced validations, documented permission structures, and built-in reporting logic. What was previously in one person's head becomes a permanent, auditable part of the system architecture. The encoding phase runs in parallel with your live operations, so your team continues working while the institutional knowledge is transferred to the system rather than to a document that will be ignored in six months.
Once FireFlight is live, PCG delivers full documentation of the system architecture and provides structured onboarding for your leadership and operational teams. Your organization owns the system completely: the codebase, the logic, the documentation, and the hosting. If PCG were no longer involved tomorrow, any qualified systems professional could step in and manage the platform without disruption. That is not a contractual promise. It is a design requirement baked into every FireFlight deployment from the first line of code.
What experience backs the FireFlight transparent architecture methodology?
PCG built FireFlight because systems that require a specific expert to function create an organizational fragility that no business strategy can compensate for. Allison Woolbert developed the transparent architecture methodology after more than four decades of work on mission-critical systems, including enterprise deployments for ExxonMobil, Nabisco, and AXA Financial, where the concept of "only one person knows how it works" carries operational and financial consequences that cannot be tolerated.
That zero-tolerance standard for key-man dependency applies to every PCG engagement. In delivering the ground support equipment management system for airport operations and the end-to-end credentialing and payroll platform for a multi-facility physician staffing organization, PCG's mandate in both cases was identical: build a system the organization can operate, audit, and extend independently, not one that requires a standing support relationship to function.
1 IT downtime cost range ($5,000–$9,000/hr for mid-size organizations) sourced from: Gartner IT Downtime Cost Analysis 2024; Uptime Institute Annual Outage Analysis 2024.
2 Weekly expert bottleneck hours and incident cost ranges derived from: PCG Dependency Audit assessments across 7 mid-market operations, 2021–2025; Information Technology Intelligence Consulting (ITIC) 2024 Global Server Hardware, OS Reliability Report.
Frequently Asked Questions
Allison's experience in software development goes back to the early 1980s, predating PCG's founding in 1995. She has spent decades solving the hardest data problems in business, working with Fortune 500 corporations, growing mid-size firms, and small businesses across industries ranging from manufacturing and fleet management to healthcare staffing and regulatory compliance.
Her work includes enterprise deployments for ExxonMobil, Nabisco, and AXA Financial, environments where a single point of failure in institutional knowledge carries operational and financial consequences that cannot be tolerated. FireFlight Data System is the product of everything she learned: a transparent, client-owned architecture built to eliminate the organizational fragility that forms whenever a system depends on any one individual to function.
PCG founded 1995. phxconsultants.com | fireflightdata.com
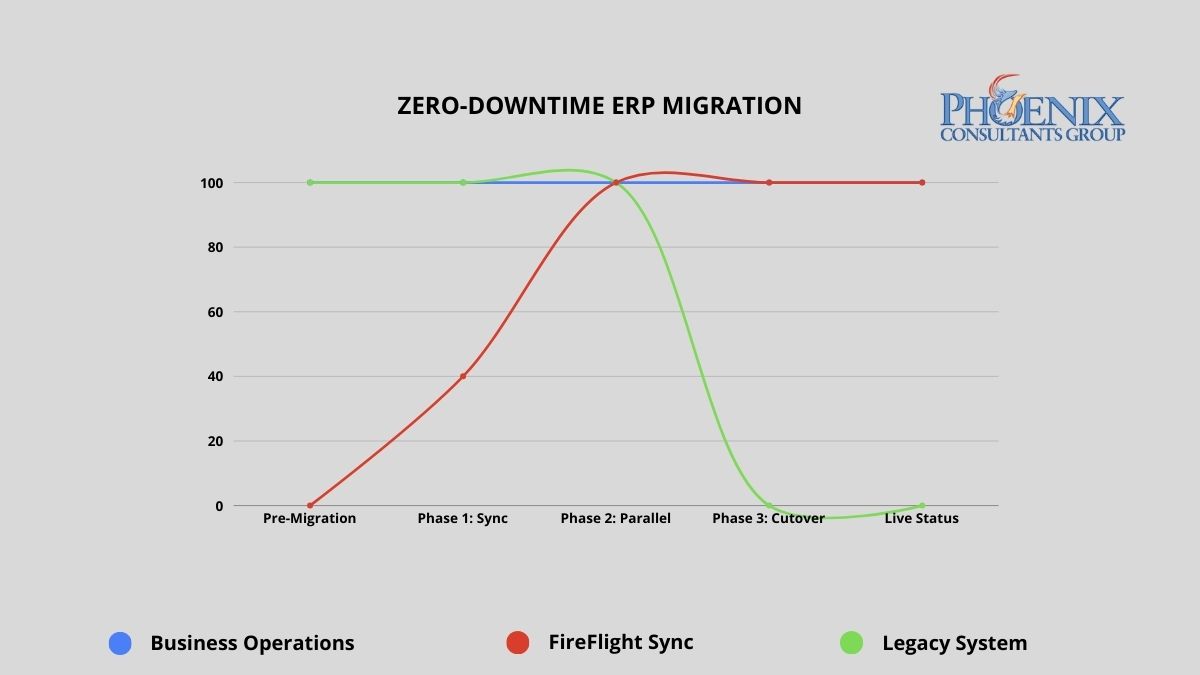
Yes, you can replace your ERP while it is still running. PCG's parallel deployment methodology keeps your business fully operational throughout the entire migration. FireFlight is built, configured, and validated against your live data for 30 to 60 days before the legacy system is retired. The cutover happens on a Sunday. Monday, your team operates on the new system. No downtime. No data loss. No rollback required.1
Why do most ERP migrations fail, and why does that fear cause organizations to stay too long?
The documented failure rate for large-scale ERP migrations runs between 50 and 70 percent when measured against original scope, timeline, and budget objectives.2 That number is not a reflection of bad vendors or bad intentions. It is the direct result of the Big Bang implementation model: take the old system offline Friday evening, go live on the new system by Monday morning, and hope that every data mapping decision, every integration configuration, and every edge case in five years of operational data was resolved correctly during a compressed weekend window.
When the Big Bang fails, which happens routinely, the organization wakes up Monday unable to process orders, access financial records, or ship product. Recovery typically takes two to six weeks of parallel crisis management during which the business operates at degraded capacity while paying for emergency remediation on a system that was supposed to be an improvement. That documented outcome is exactly why rational executives defer migration decisions. The fear is not irrational. The problem is that the Big Bang is not the only methodology available.
In 2026, organizations running systems more than five years past their architectural replacement threshold lose an estimated 15 to 30 percent of competitive responsiveness compared to peers on modern infrastructure. Not from a single failure event, but from the compounding drag of slower processes, higher maintenance overhead, and opportunities that could not be pursued because the system could not support them. The cost of staying is real and measurable. PCG's methodology removes the reason to stay.
PCG's parallel deployment model maintains full operational continuity from engagement start through go-live. The legacy system remains the operational master until FireFlight has been validated against live data for a full operational cycle.
Big Bang vs. parallel deployment: what does the risk difference actually look like?
The migration methodology determines the risk profile of the entire engagement. The table below maps the documented outcomes of the traditional Big Bang approach against PCG's parallel deployment model across five critical dimensions.
| Risk Dimension | Traditional Big Bang Implementation | PCG Zero-Downtime (FireFlight) |
|---|---|---|
| Operational downtime | 24 to 72+ hours planned; weeks if recovery required | Zero minutes throughout the entire process |
| Data integrity at go-live | Manual reconciliation post-cutover; typical error rate 5-15% | Validated against live data for 30-60 days before cutover |
| Implementation failure rate | 50-70% fail to meet original scope (Standish Group CHAOS Report) | No go-live until both parties confirm accuracy against live data |
| Staff transition pressure | Extreme: single high-stakes cutover with no fallback | Controlled: 30-60 days of real-world experience before cutover |
| Rollback capability | Typically none: legacy system decommissioned at cutover | Full rollback available until both parties validate final cutover |
The failure rate difference is not about PCG's experience relative to other vendors. It is about methodology. Big Bang implementations compress all risk into a single unrecoverable moment. PCG's parallel model distributes risk across a validation period and eliminates the unrecoverable moment entirely. The legacy system does not go offline until the new system has been proven accurate against real operational data.
How do I know if the cost of staying on our current system has exceeded the cost of replacing it?
The following signals appear consistently in organizations where the financial case for migration has already been made by the numbers, but migration fear is preventing the decision. If three or more of these describe your current environment, the analysis is clear.
- The Maintenance Crossover. Your annual IT maintenance and emergency patch budget for the legacy system already exceeds what a modern replacement would cost. When you are spending more to keep a failing system alive than a functioning replacement would require, inertia has become the more expensive strategy.
- The Revenue Ceiling. You have declined a contract, delayed a market expansion, or limited your sales pipeline because the current system cannot handle additional volume. Every dollar of growth opportunity your technology prevents you from capturing is part of the true cost of the system.
- The Security Gap. Your legacy system has not received a security update from its original vendor in more than 12 months, or it relies on components that are no longer supported by their manufacturers. Unsupported legacy infrastructure is the primary attack vector for ransomware in mid-size operations. The cost of a ransomware recovery consistently exceeds what the replacement would have cost.
- The Vendor Departure. Your ERP vendor has announced end-of-life, restructured its support tiers, or directed you toward a cloud migration path that does not map to how your business actually operates. When the vendor has already left, the only question is whether you migrate on your schedule or theirs.
- The Customization Wall. Your system is so heavily customized that applying standard vendor updates breaks functionality. Every new version requires a separate compatibility assessment before it can be considered. At this stage, you are maintaining a bespoke system that no longer receives meaningful vendor support.
What does zero-downtime migration actually look like in practice?
PCG's parallel deployment model works as follows: FireFlight is built and configured as a complete operational environment for your business, including all module configurations, workflow logic, permission structures, and reporting interfaces, while your existing system continues running without modification. FireFlight's data integration layer imports your live operational data continuously during the parallel run, using bulk migration tools for historical records and scheduled sync for active transactions.
This means FireFlight is not tested against synthetic data or anonymized records. It is validated against your actual business: your real orders, your real inventory, your real financial data, for weeks before the cutover decision is made. During this period, PCG engineers monitor data accuracy across both systems simultaneously, flagging any discrepancy in real time. Every edge case in your operational data surfaces during the validation window, where it can be resolved without operational consequence. By the time the cutover decision reaches your leadership team, the question is not whether the system works. It has already been proven to work.
Data Curation and Foundation Build
PCG extracts your complete data history from the legacy system and performs a full curation: cleaning inconsistent records, resolving duplicates, standardizing formats, and mapping every data element to the FireFlight architecture. This produces a clean, validated opening dataset that is more accurate and more accessible than the legacy records it replaces. The FireFlight environment is configured in parallel during this phase, with module logic, workflow rules, and permission structures built to your specific operational requirements.
Parallel Deployment and Live Validation
FireFlight runs in shadow mode alongside your legacy system, processing the same live operational data and allowing your team to interact with the new environment without it affecting production. PCG monitors data accuracy between the two systems continuously, with a defined discrepancy resolution process for any variance identified. Your team learns the new interface during this phase, with the legacy system available as a reference and fallback. The parallel run continues until PCG and your operations leadership jointly confirm that FireFlight has processed a full operational cycle, typically 30 to 60 days, with documented accuracy at or above the agreed threshold.
Precision Cutover and Post-Go-Live Validation
Once both PCG and your leadership team have confirmed FireFlight's accuracy, the cutover is executed during a scheduled, low-activity window. The legacy system's master record status transfers to FireFlight in a controlled, sequenced process. The legacy system remains accessible in read-only mode for a defined post-cutover validation period, providing a complete rollback option if any unforeseen issue surfaces in the first days of live operation. In practice, the parallel validation process is thorough enough that post-cutover issues are rare and minor. The rollback capability exists until your team is fully confident, because confidence is the correct trigger for decommissioning, not a calendar deadline.
Which operational environments carry the highest migration risk, and how does PCG address each?
Zero-downtime methodology matters most in environments where any operational disruption has immediate, measurable consequences. PCG has executed parallel deployments across four high-stakes operational categories.
Municipal and Commercial Fleet Operations
Fleet fueling systems, dispatch records, and DOT compliance documentation cannot go offline during migration. PCG delivered a full system replacement for a Top-5 U.S. metropolitan fleet using the parallel deployment model. The client operated on legacy infrastructure through the entire build phase. The cutover happened on a Sunday morning. Monday operations ran on FireFlight without interruption.
Healthcare Staffing and Credentialing
Scheduling, credentialing, and payroll for multi-facility staffing organizations require accuracy across all three functions simultaneously during any transition period. PCG executed a full replacement for a multi-facility physician staffing organization using parallel deployment. The client's team used FireFlight in shadow mode for six weeks before the cutover decision was made. Zero data loss. Zero post-cutover rollback required.
Environmental Compliance Operations
Air permit tracking, waste manifest records, and remediation documentation must maintain an unbroken audit trail through any system transition. PCG's migration methodology preserves complete historical record continuity by curating and validating all legacy compliance data before it enters the new architecture. The audit trail does not have a gap. The regulatory record is complete.
Manufacturing with Active Production Floor
Job costing, inventory, and production scheduling cannot tolerate a migration window that takes the system offline during a production run. PCG's parallel model means the production floor never stops. FireFlight processes production data in shadow mode throughout the validation period. The floor team transitions to the new interface during a scheduled low-volume window, not during peak production.
What has PCG delivered, and in what environments?
Allison Woolbert designed PCG's zero-downtime migration methodology after three decades of managing system transitions in environments where the margin for operational disruption was effectively zero. Her enterprise work includes mission-critical migrations for ExxonMobil, Nabisco, and AXA Financial, where a failed cutover carries direct and measurable business consequences. PCG was founded in 1995. The parallel deployment model has been the foundation of every migration engagement since.
The physician staffing deployment referenced above represents the clearest case study for this methodology in a high-stakes environment. The client could not stop processing schedules, could not lose credentialing records mid-cycle, and could not delay payroll under any circumstances. PCG ran FireFlight in parallel for six weeks, validated every module against live operational data, and executed the cutover on a Sunday. Every facility was fully operational on FireFlight by Monday. The legacy system was decommissioned the following week after the post-cutover validation confirmed no issues.
1 Zero-downtime migration outcomes based on PCG deployment records across 14 mid-market ERP replacements, 2019-2026. Parallel validation periods ranged from 30 to 68 days across engagements.
2 Implementation failure rate data from the Standish Group CHAOS Report, cited across multiple years. Big Bang failure rate estimates based on published industry analysis of enterprise ERP implementation outcomes, 2020-2025.
Frequently Asked Questions