For environmental and engineering teams whose work orders, equipment maintenance, and job costs still live across spreadsheets, whiteboards, and email. FireFlight pulls that field work onto one operating record.
FireFlight is field operations software built by Phoenix Consultants Group. It connects work orders, equipment maintenance, assets, and projects on one record, so your team can see what is running, what is down, and what is due without checking five places.
The hard way
Your operation outgrew spreadsheets a long time ago
Equipment goes down
A truck or a rig stops and nobody sees the open work order until the whole crew is backed up.
Maintenance slips
A service was due last week but lived in a sheet nobody checked, so the machine failed instead.
Jobs lose track
Project costs are scattered across files, so a job slips behind before anyone can see the numbers.
The connected way
One system that runs the site, not ten that track it
Put the work on one record so orders, equipment, assets, and jobs stay connected on a single database.
Stay ahead of maintenance so a service that is due or overdue shows up before the machine fails.
See work order status as it changes so what is in progress, waiting, or behind is visible before it becomes a problem.
Track job cost against the work so a project that is slipping is something you watch, not something you find out later.
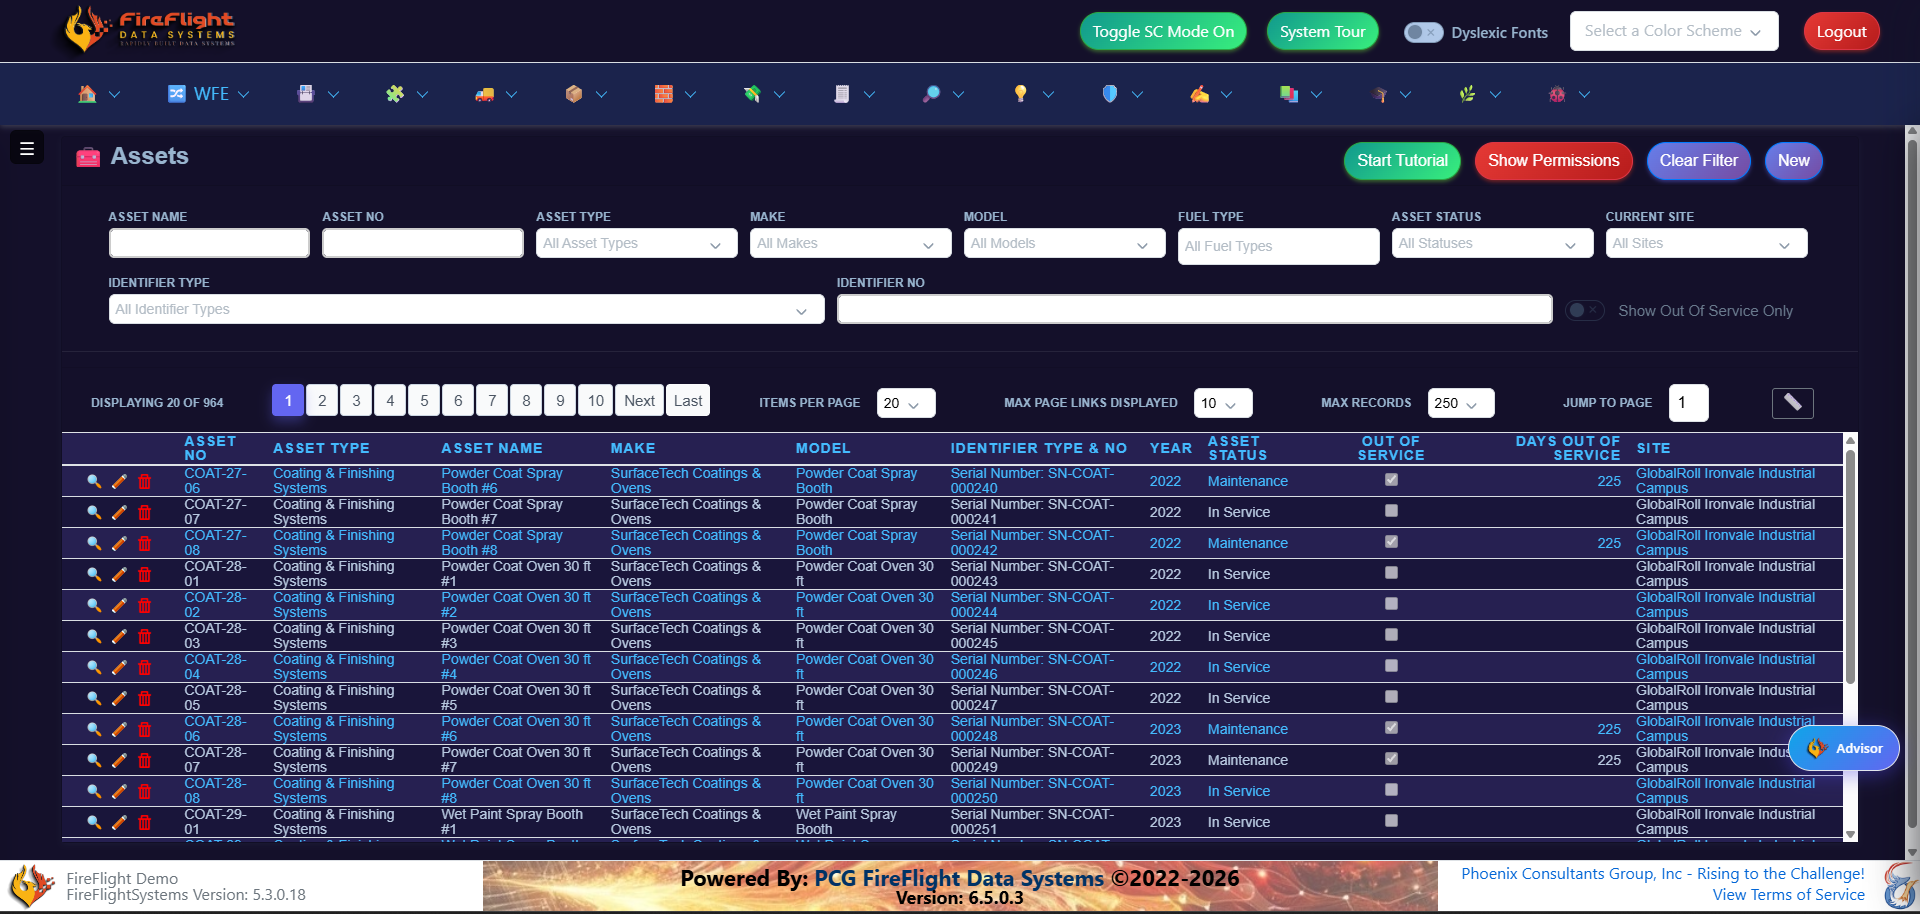
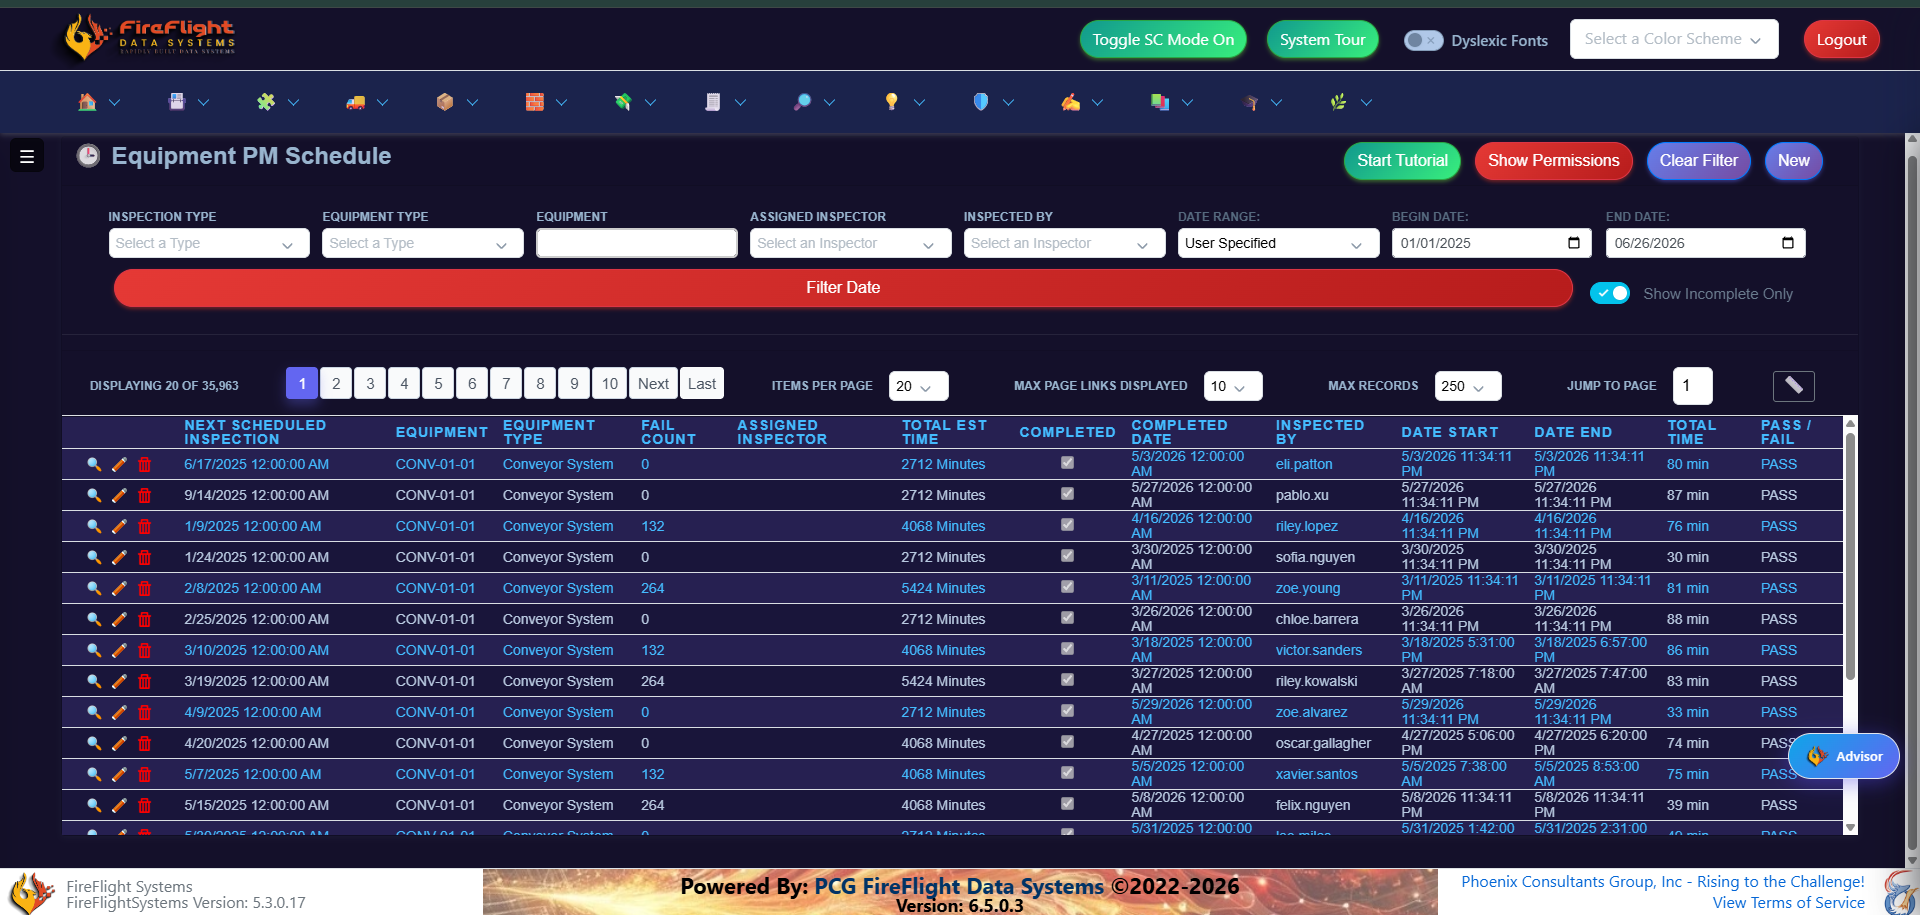
Equipment and maintenance
Keep your equipment running, not guessing
Every asset has a record: what it is, where it sits, and what is due next. Preventive maintenance runs on a schedule the system tracks for you, so a missed service shows up before a breakdown does.
Every machine tracked with status, site, and service history.Preventive maintenance scheduled and flagged before it is due.
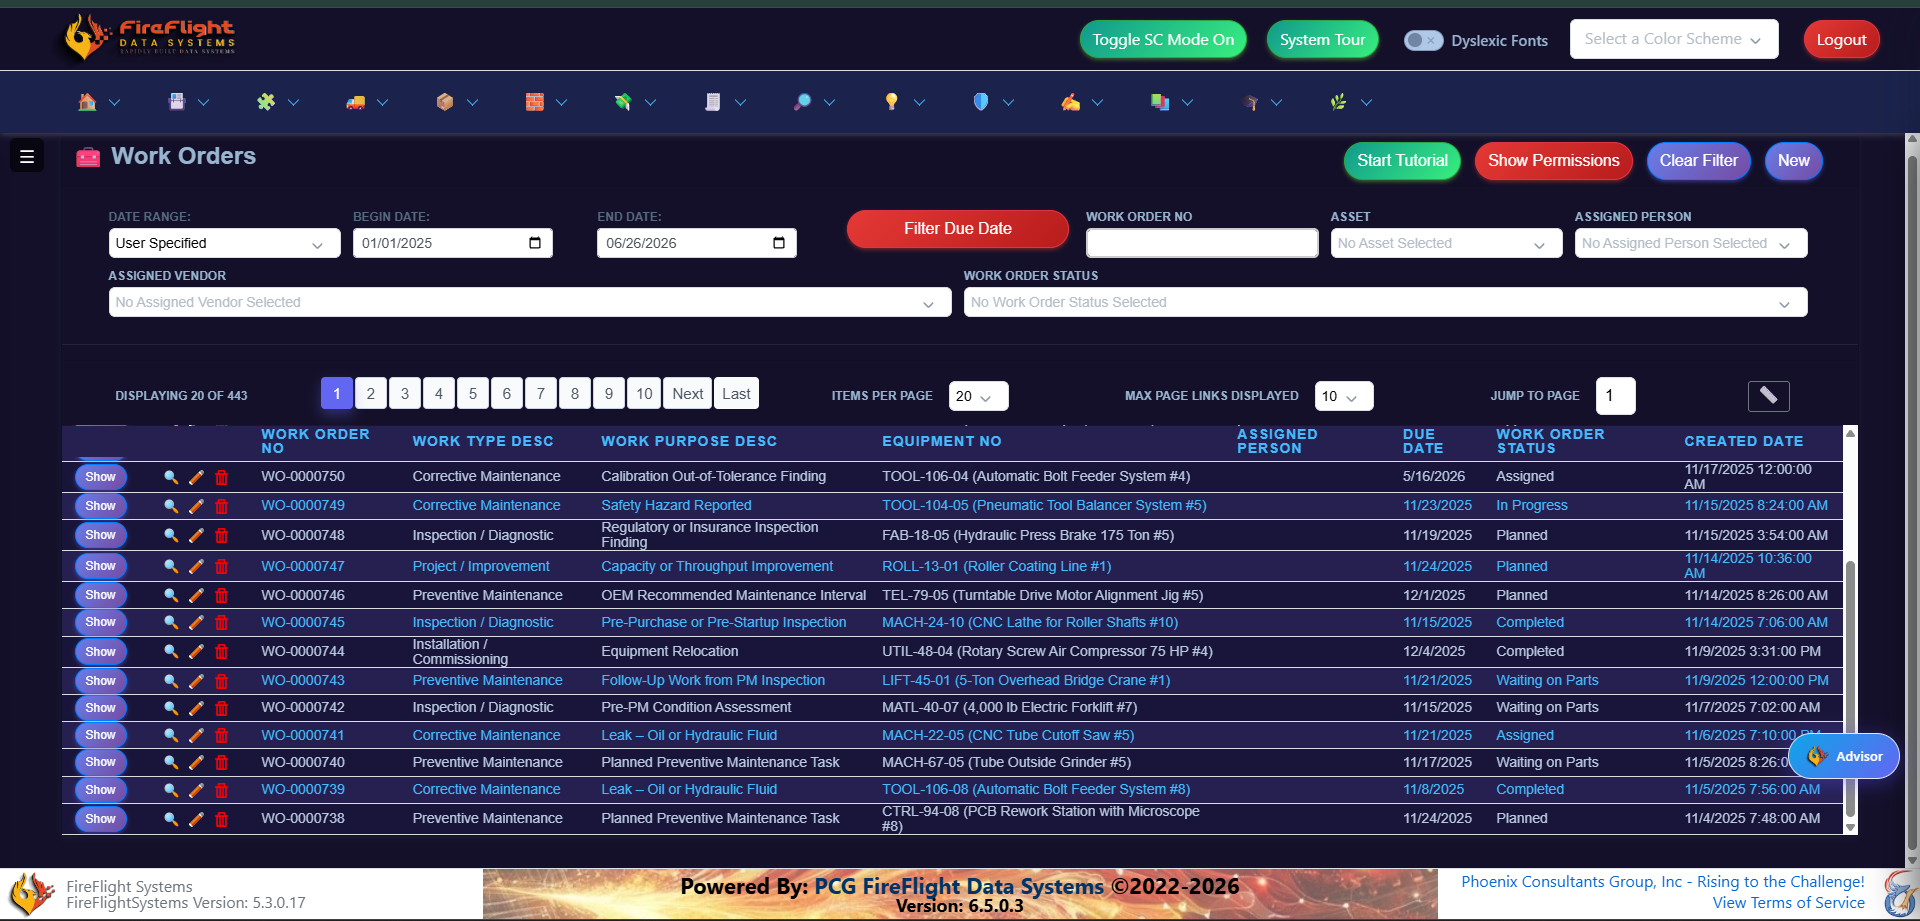
Work orders
See every work order and where it stands
Work orders live in one view, from the moment they open to the moment they close. You see what is in progress, what is waiting on parts, and what is behind, without asking three people or checking a whiteboard.
Every order with its status, equipment, due date, and work type.
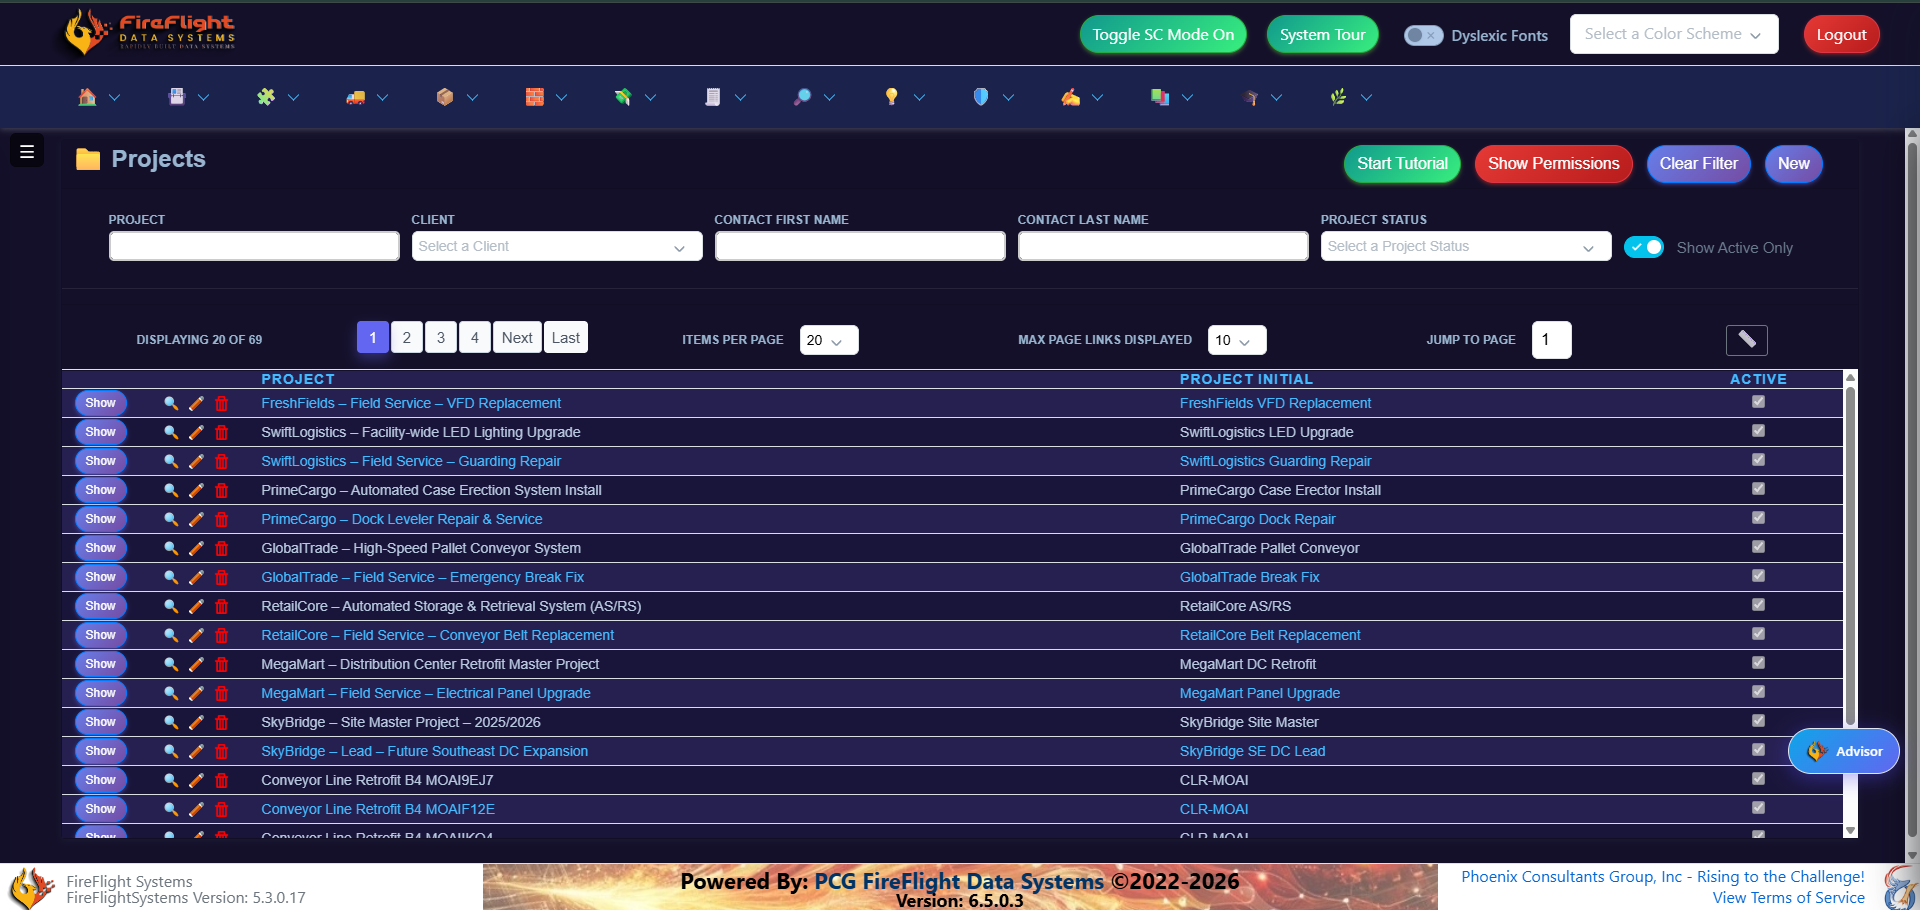
Projects
Track every project and what it costs
Each project holds its own work and costs in one place, so you know what stage a job is in and what it is running you. Contract dates and current dates sit side by side, so a project that is slipping shows up while there is still time to act.
Active jobs in one list, with contract dates against current progress.
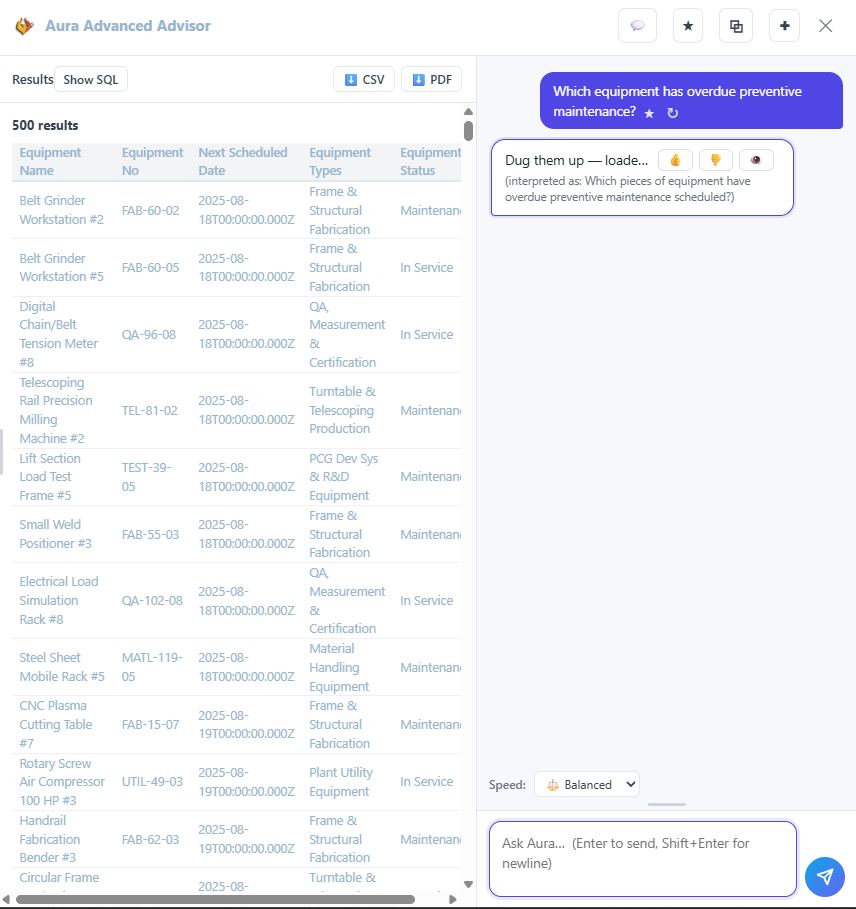
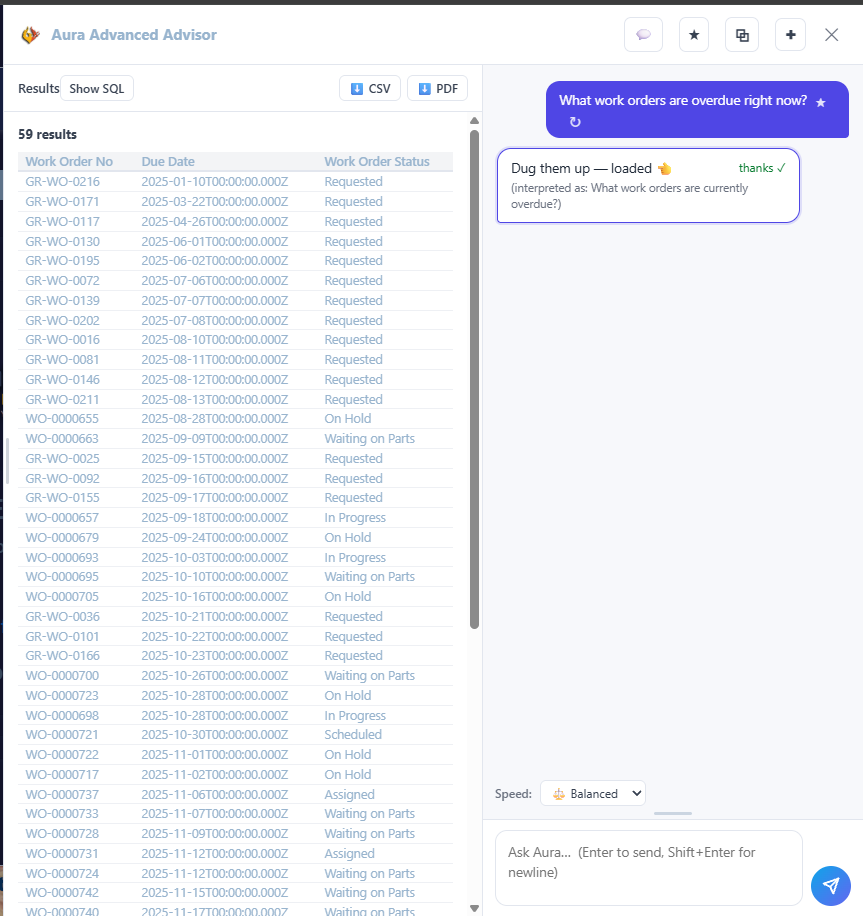
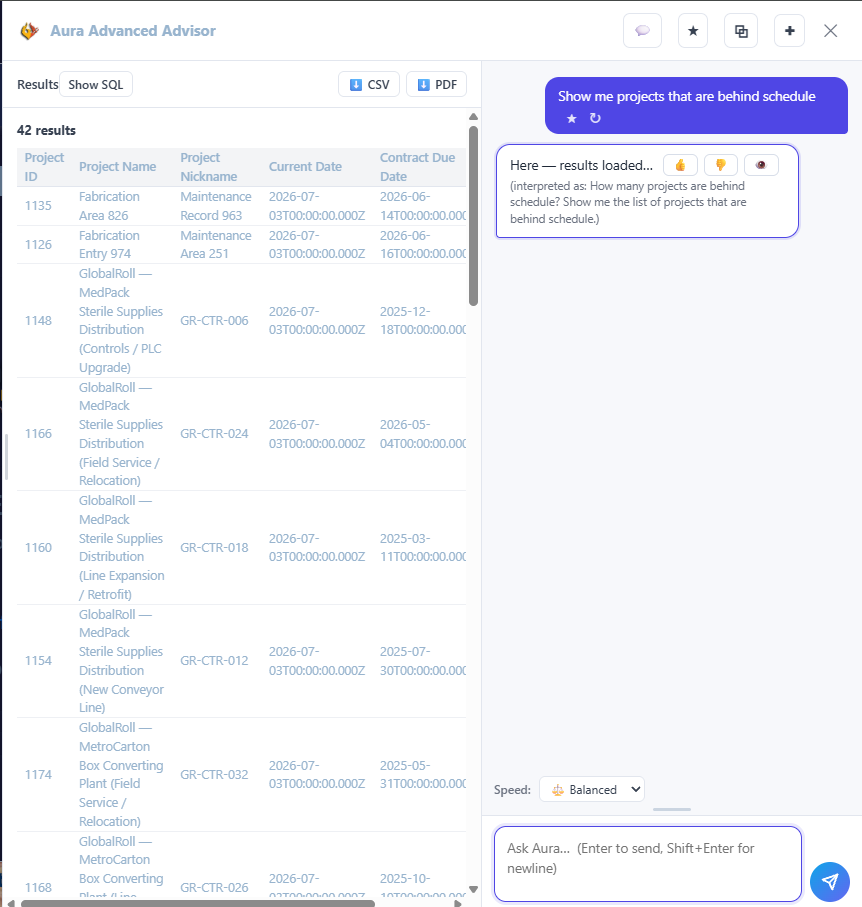
Ask your operation
Simple questions, answers from your live data
When you need something specific, you do not build a report or export to a spreadsheet. You ask FireFlight in plain English and it returns the matching records, ready to export if you need them. It is built into every deployment.
Which equipment has overdue preventive maintenance?What work orders are overdue right now?Show me projects that are behind schedule.
Best fit
Built for environmental and engineering field operations
FireFlight is built for field operations that need one clear view of equipment, work orders, and jobs, instead of records scattered across separate tools.
Environmental servicesField crews running sampling, monitoring, and compliance work across many sites.
Remediation and industrial servicesOperations with rigs, vacuum trucks, and heavy equipment that has to stay in service.
Site and civil engineeringProject-based firms tracking field work, inspections, and job cost together.
Testing and inspectionLabs and field teams tracking equipment, work orders, and results in one place.
Field service crewsTeams whose day runs on work orders, assets, and jobs, not scattered sheets.
Multi-site operationsFirms that need work order, equipment, and project status visible across locations.
Why PCG
Operational software is what PCG has built since 1995
FireFlight is configured around your workflow so your team is not forced into a rigid off-the-shelf product.
PCG hosts and maintains the platform so your team can focus on the work instead of servers, updates, and infrastructure.
Your data stays yours and can be exported, reported, and used across your operation.
Support is direct so you can talk to people who understand the system and the work behind it.
Questions
Common questions about FireFlight
Is FireFlight built for field operations?+
FireFlight is configured per operation. For environmental, engineering, and field service firms, that means work orders, preventive maintenance, asset tracking, and project management set up around your crews and equipment. PCG builds and hosts the platform and configures the modules your operation actually uses.
How is this different from a spreadsheet?+
A spreadsheet tracks what already happened. FireFlight runs the work as it happens, with every order, machine, and job reading from the same live data, so nothing falls out of sync between shifts or sites.
Can teams ask questions in plain English?+
Yes. You can ask FireFlight in plain English, such as which equipment is overdue for maintenance or which work orders are behind, and get the answer from your live data without building a report. This is included in every deployment.
Who owns the data, and who runs the platform?+
Your data is yours, and you can export it at any time. PCG builds, hosts, and maintains FireFlight as a service, so your team never has to manage servers or updates.
How long does it take to go live?+
Timelines vary by operation and the modules involved. FireFlight is built to configure faster than a traditional custom build, and PCG runs the new system alongside your current process so nothing stops during the transition.
What does getting started look like?+
You request access to the demo and walk through the system with your own operation in mind. There is no commitment beyond that.
See FireFlight running your kind of operation
Get access to the demo and walk through equipment, work orders, projects, and the plain-English query with your own questions in mind.
Your legacy ERP is still running. But running is not the same as working. Learn how to calculate what an outdated ERP is actually costing your operation and what a realistic transition plan looks like.
Last updated: May 2026 Phoenix Consultants Group | Custom Software ROI Framework for Small and Mid-Sized Businesses You measure ROI on custom software by capturing a baseline before go-live, picking three or four workflows to track, and running structured reviews at 3, 6, and 12 months. The answer is not one number. It is a […]
PCG built a soil remediation tracking system for an EPA Superfund cleanup site. The system recorded volumes of contaminated soil removed, source and destination locations, contamination testing results, and remaining quantities still requiring treatment. A custom calculation engine projected forward to estimate how much soil remained, giving the client visibility into project timeline, cost, and regulatory progress for a federally supervised environmental cleanup.
EPASuperfund federal supervision oversight
CERCLACompliance framework for cleanup tracking
ForwardProjection engine for remaining remediation
Multi-sourceVolume, location, and testing data unified
What was breaking in soil remediation tracking before this project?
The client was managing an active Superfund cleanup under EPA oversight. Federally supervised environmental remediation comes with reporting obligations that the project sponsor cannot defer or simplify. Volumes of contaminated soil removed must be documented at the cubic yard level. Source locations and destination disposal sites must be traceable for every load. Contamination testing results must link back to the specific soil they describe. And the projection of how much soil remains to be treated, which determines the timeline and cost trajectory of the entire cleanup, must be defensible to the regulator.
Spreadsheets do not survive that scrutiny. They lose data integrity as multiple people edit them. They cannot enforce relationships between source location, destination, and testing record. They produce projections that no one can audit because the formulas drift over time. For a Superfund site under active EPA supervision, that is not an inconvenience. It is a regulatory exposure that grows with every reporting cycle.
Disconnected Data
Soil volumes, source and destination locations, and testing results lived in separate spreadsheets and files with no enforced relationships between them.
No Forward Projection
The client had no defensible calculation of how much soil remained to be treated, so timeline and cost projections to EPA were estimates rather than data-driven figures.
Audit Reconstruction Burden
Every EPA reporting cycle required manual reconstruction of the chain from source soil to destination disposal to testing records.
Federal Compliance Risk
Superfund sites operate under continuous EPA supervision. Reporting gaps or inconsistencies surface immediately and become part of the regulatory record.
For a Superfund cleanup, the consequences of weak tracking infrastructure compound over time. EPA does not forget reporting gaps. Timeline projections that turn out to be inaccurate get challenged in subsequent reviews. Funding decisions for the remaining cleanup phases depend on the credibility of the data presented. A tracking system that cannot defend its own outputs creates problems that outlive the cleanup itself.
What did PCG actually build for the EPA Superfund tracking environment?
PCG developed a database-backed tracking system designed specifically for federally supervised soil remediation. The architecture handled the complete data chain from contaminated source through testing through disposal destination, with a forward projection engine that produced defensible estimates of remaining work. Each component was built so that the data trail required by EPA auditors was captured at the moment work happened, not reconstructed afterward.
1
Soil volume tracking by source location
Every cubic yard of contaminated soil removed from the site was logged against its source location within the cleanup area. The system tracked extraction sequences, soil type, and the date and time of each removal. Source data became the anchor that every subsequent record linked back to.
2
Destination disposal site logging
Each load of removed soil was tracked from source to destination. Disposal site records included the receiving facility, transport documentation, and chain-of-custody. EPA reporting requires this trail. The system captured it as a structured record rather than a paper manifest reconstructed at the end of each reporting period.
3
Contamination testing results linked to soil
Testing results from soil samples were linked directly to the specific soil they characterized. Test method, lab, results by analyte, and date were captured against each source location. When a question arose about the contamination profile of soil sent to a specific disposal facility, the answer was a query rather than a manual file search.
4
Custom forward projection calculation engine
The system included a calculation engine that projected forward to estimate remaining soil quantities still requiring treatment. Inputs included treated volumes, contamination boundaries, treatment effectiveness, and remediation rates. The engine produced timeline and cost projections that were defensible to EPA because the calculations were transparent and the underlying data was queryable.
5
Regulatory progress visibility for the client
The system gave the client real-time visibility into project timeline, cost trajectory, and regulatory progress against the EPA-approved cleanup plan. Quantities removed, quantities remaining, projected completion, and costs to date were available without manual rollup from spreadsheets. EPA reporting cycles became data extracts from the live system.
What we learned on this project
Superfund sites fail their tracking obligations in a specific way. The site team usually has the data. They just cannot produce it in the form EPA requires within the timeline EPA expects. A tracking system that captures data at the moment of work and structures it for the format regulators ask for changes the equation. The data was always there. The infrastructure to surface it was not.
The forward projection engine was the part that created the most strategic value, beyond the regulatory reporting. A project sponsor who can produce a defensible estimate of remaining cleanup work has a different conversation with EPA, with funders, and with internal stakeholders than a project sponsor who is producing best-guess timelines from spreadsheets. The number itself is less important than the auditability of how the number was produced.
What changed after the system went into production?
The most immediate change was that EPA reporting cycles stopped being reconstruction projects. The data trail from source soil through testing through disposal destination was already captured and structured. Reports became data extracts. The team's effort moved from assembling reports to running the cleanup.
Outcome
Result
How it was achieved
EPA reporting timeline
Data extracts, not reconstructions
Source-to-destination chain captured at the moment of work, structured for regulator format
Forward projection of remaining work
Defensible to regulator
Custom calculation engine with transparent inputs and queryable underlying data
Source-to-disposal chain of custody
Continuous and complete
Every load tracked from source location through destination disposal facility
Contamination testing traceability
Linked at the source-record level
Testing results attached directly to the soil they characterized, by source and date
Project timeline visibility
Real-time
Treated volumes, remaining volumes, and projected completion available on demand
Cost trajectory tracking
Tied to actual cleanup data
Costs attributed to source locations and treatment phases as work progressed
The strategic value of the system extended beyond EPA reporting itself. Real-time projection of remaining cleanup work changed the client's ability to manage the project against budget and schedule. Decisions that had previously waited for the next reporting cycle could be made on current data. Funding conversations that had been based on best-guess timelines became conversations grounded in defensible projections.
What capabilities does this kind of system provide for federally supervised environmental cleanup?
The infrastructure built for this Superfund site addresses a problem class that appears across every environmental remediation project under federal or state regulatory oversight. The capabilities below apply to CERCLA Superfund work, RCRA corrective action, state-led brownfield cleanups, voluntary cleanup programs, and any operation where soil, groundwater, or other contamination is being tracked from contaminated source through treatment or disposal.
Source-to-destination chain of custody
Every cubic yard of contaminated material tracked from source location through transport through destination disposal facility. The chain that EPA and state regulators require is captured automatically at each handoff rather than reconstructed at the end of reporting cycles.
Defensible forward projections
A calculation engine that estimates remaining cleanup work based on transparent inputs and queryable underlying data. Project sponsors can produce timeline and cost projections that hold up to regulator review and stakeholder scrutiny.
Testing data linked to physical soil
Contamination testing results connected directly to the specific source location, sample, and material they describe. When a question arises about the contamination profile of material sent to a specific facility, the answer is a query against linked records, not a manual file search.
Real-time regulatory progress visibility
Treated volumes, remaining volumes, projected completion dates, and cost trajectory available on demand against the EPA-approved cleanup plan. Project decisions stop waiting for the next reporting cycle to be made on current data.
Technology stack
Component
Technology
Database layer
Relational database with enforced source-destination-testing relationships
Calculation engine
Custom forward projection logic with transparent input parameters
Data capture
Spreadsheet and database integration for field data entry
Chain of custody
Source location, transport, and destination logged as linked records
Testing integration
Lab results linked at the source-record level by sample, method, and date
Reporting layer
EPA-format data extracts produced from live system queries
Compliance framework
CERCLA / Superfund supervision with EPA reporting alignment
Does this apply if your cleanup is smaller than a full Superfund site?
The architecture scales down as well as up. State-led brownfield cleanups, voluntary cleanup programs, RCRA corrective action sites, and private remediation under regulatory oversight all face the same core problems as a Superfund site: source-to-destination chain of custody, testing data linked to physical material, defensible forward projections, and reporting that aligns with regulator format. The engineering decisions on this project transfer directly to cleanups an order of magnitude smaller.
What makes this project transferable is not the regulatory framework. It is the problem class. Any environmental cleanup where contaminated material moves from source through testing through disposal, under any oversight regime, is carrying the same data integrity risk this Superfund site was carrying before the system went live. The risk accumulates invisibly until a regulator asks a question the data cannot answer in the form required.
PCG has built environmental compliance and remediation infrastructure since 1995. The work documented here is one of more than 500 production applications PCG has delivered, with environmental and regulatory compliance representing approximately one-third of that volume across 31 years.
Frequently asked questions about Superfund and environmental remediation tracking systems
Yes. PCG has built tracking infrastructure for federally supervised environmental cleanup work, including Superfund sites under EPA oversight. The architecture handles soil volume tracking by source location, destination disposal logging, contamination testing results linked at the source-record level, and a custom forward projection calculation engine for remaining cleanup work. Deployments have supported active CERCLA-regulated cleanups with continuous EPA reporting obligations.
The forward projection engine takes treated volumes, contamination boundaries, treatment effectiveness measurements, and historical remediation rates as inputs. It produces estimates of remaining soil quantities still requiring treatment, projected timeline to cleanup completion, and projected cost trajectory. The calculations are transparent and the underlying data is queryable, which is what makes the projections defensible to EPA reviewers rather than best-guess estimates.
Every load of removed soil is tracked from source location through transport through destination disposal facility. Records include the source location within the cleanup site, soil volume by cubic yard, transport documentation, receiving facility, and date and time of each handoff. Chain-of-custody requirements that EPA imposes for federally supervised cleanups are captured at the moment work happens rather than reconstructed at reporting time.
Testing results are linked directly to the source location, sample, and removal record they characterize. Records include test method, lab, results by analyte, and date. When a question arises about the contamination profile of material sent to a specific disposal facility, the answer is a query that returns the linked testing record rather than a manual file search through email attachments and lab reports.
Yes. The architecture transfers directly to state-led brownfield cleanups, voluntary cleanup programs, RCRA corrective action sites, and private remediation under any regulatory oversight regime. The data structures, chain of custody requirements, and projection logic are similar across regulatory frameworks. The forms and report formats differ. PCG configures the reporting layer to match the format the relevant regulator requires.
Yes. Most active remediation projects PCG works with already have historical data in spreadsheets, paper logs, and lab report files. The migration consolidates existing records, reconstructs the source-to-destination relationships where possible, and preserves the historical trail that regulators may request retroactively. Original files remain available for reference. The migration approach is documented before any data movement begins.
EPA reports become data extracts from the live tracking system rather than manual reconstructions assembled at the end of each reporting period. The data structure aligns with the format EPA expects, which removes the translation layer that consumes staff time at every cycle. Reports that previously required days of file assembly are produced as queries against the live system. Site teams spend reporting cycles running the cleanup rather than building reports.
Yes. Full source code ownership transfers to the client at project completion. All remediation data captured by the system belongs to the client. Documentation of the database schema, calculation engine logic, and operational procedures is delivered as part of the project. Clients are not dependent on PCG to maintain the system, although most engagements continue under a monthly support retainer for hosting, maintenance, and minor modifications.
About the engineer behind this projectAllison Woolbert, Principal, Phoenix Consultants Group
Allison has been building custom software since the early 1980s, including work as a data analyst for the U.S. Air Force before founding PCG in 1995. The Superfund remediation tracking documented here is one of more than 500 custom applications PCG has delivered, with environmental and regulatory compliance representing approximately one-third of that volume across 31 years. Her direct involvement in every project is not a policy. It is how PCG operates. When you call, she answers.
Running a federally supervised environmental cleanup on spreadsheets that cannot defend their own projections?
PCG has built environmental compliance and remediation tracking infrastructure since 1995. The diagnostic engagement takes two to three hours and produces a written scope before any development commitment.
Project details documented with client permission. Specific identifying details about the Superfund site have been generalized. System capabilities and architecture reflect the actual production deployment.
PCG founded 1995. Allison Woolbert's personal experience in software development predates PCG's founding.
There is a specific kind of message that stops a leader cold.“Hey, do you have a few minutes today? I’ve got some news.”You already know what comes next. Your developer, the one whose name comes up every time someone says “we should ask before touching that,” is leaving.New offer. Burnout. Career change. The reason does […]
CUSTOM SOFTWARE DEVELOPMENT AND LEGACY SYSTEM MIGRATION: FOUNDED 1995
Custom .NET Software & Full-Stack Data Solutions
Phoenix Consultants Group designs, builds, and rescues custom software for industrial, environmental, and operational organizations. Since 1995, the firm has delivered more than 500 applications across fleet management, compliance tracking, healthcare staffing, public safety, and legacy system migration. When a business-critical system fails and the original developer is no longer available, PCG provides the technical resolution.
Building Custom, Data-Driven Applications That Power Business
We are a custom software development firm specializing in legacy system migration, compliance software, and full-stack .NET development for industrial and operational organizations. Founded in 1995, we have delivered more than 500 production applications. Our engineers work directly on every engagement, and all technical inquiries are handled by the engineer assigned to the project.
Last updated: April 2026
Technical Capabilities
Core Development and Migration Services
Custom .NET Software Development
PCG develops production software on C# .NET Core, ASP.NET Core, Razor Pages, and SQL Server for organizations whose operational requirements exceed the capabilities of available commercial products. Completed systems have included fleet management platforms, physician credentialing and payroll systems, compliance tracking applications, and public safety dispatch software. Clients retain full ownership of their data, with complete documentation.
Compliance software has represented approximately one-third of PCG's three-decade project volume: waste manifests, air permits, EPA Title V, remediation documentation, and OSHA record keeping. FireFlight Data System is a modular platform developed and maintained exclusively by PCG for environmental compliance and industrial operations, delivering that same depth of domain experience in a fully hosted, directly supported system.
PCG migrates Access databases, VB6 applications, FoxPro systems, legacy ASP applications, and Excel-based operational systems to current .NET Core architecture. Business logic, data integrity, and process workflows are preserved through the migration. Existing documentation is not a prerequisite for initiating an engagement. PCG performs technical reconstruction where source documentation is absent.
Experienced Database Administrators and Software Engineers Since 1983
At Phoenix Consultants Group, our database administrators have been developing and delivering data collection and data management applications since 1983. We have the depth of experience required to write software that meets and exceeds client requirements, with extensive work in database synchronization, multi-source data collection, and the architecture of compact, high-performance database systems.
We maintain active expertise in both current and legacy programming environments, enabling us to migrate, maintain, and modernize systems regardless of the platform on which they were originally built
Programming Expertise in Both Modern and Legacy Languages
We have maintained current expertise across both modern development frameworks and legacy languages. This dual capability is the technical foundation for our migration work: our engineers understand both the platform a system was built on and the platform it is being migrated toward.
Visual Basic, Visual Basic for Applications, SQL Server, Microsoft Access & Excel, ASP, C#.Net, Visual Basic.NET, Razor.NET, Core.NET, ASP.NET.
Technical Situations That Typically Precede an Engagement With Us
A production system has no surviving documentation and the original developer is no longer available.
We have performed technical reconstruction and migration on production systems accumulated over 10 to 20 years of development, in cases where no documentation, design specifications, or original developer access existed. The completeness of documentation at project initiation does not determine whether a successful migration is achievable.
A Microsoft Access database is generating errors that internal staff cannot resolve.
We have maintained and migrated Microsoft Access systems across all versions of the platform since its initial release. Data corruption, version incompatibility, 32-bit architectural constraints under Windows 10 and 11, and performance degradation under scaled data volume are recurring issues with established resolution paths at PCG.
Compliance requirements are specific enough that no available commercial EHS platform provides an adequate fit.
Environmental consulting firms, industrial EHS departments, and field inspection organizations operating under agency-specific regulatory frameworks frequently encounter this gap. We have built compliance software across all three contexts: FireFlight Data System provides natural language query capability against live operational and compliance data.
A critical operational process is managed within a spreadsheet that represents an institutional single point of failure.
When the individual with working knowledge of a complex operational spreadsheet departs, the organization loses both the tool’s functionality and the institutional knowledge embedded in its logic. We convert these systems to documented, maintainable applications before that dependency becomes an operational crisis.
BUSINESS INDUSTRIES
Some Industries
That We Serve
Emergency Services
Phoenix has written software packages for emergency services, such as crew management, incident tracking, appointment scheduling and more.
Engineering
Building calculation engines, compliance monitoring, licensing requirements, documentation management systems, training systems and more for decades.
Environmental Safety
We can create technological tools to help identify and minimize negative environmental effects, as well as producing data to communicate your message.
Fortune 500
We have worked with dozens of Fortune 500's on some of their most important projects.
Industrial Safety
Phoenix has been actively programming industrial safety software for over 30 years.
Industry
Working in the Industrial Sector requires process knowledge and expertise. PCG has worked in dozens of Industrial systems.
Information Technologies
We want to meet your needs: Phoenix Consultants can efficiently expand, develop, and grow your technological impact.
Inventory Management
Understanding the full life cycle of Inventory Management means having the knowledge necessary to integrate and manage your inventory from start to finish.
Manufacturing Software
Depend on Phoenix Consultants to efficiently develop and expand your manufacturing processes.
Non Profit Services
Helping your non-profit organization with technology designed to meet your specific demands to improve processes, reduce and automate administrative duties.
Oil & Gas
From the environmental safety checks to the training programs, Phoenix Consultants Group has continually strive to better our world with our programs.
Regulation Compliance
Regulatory compliance takes accurate management of complex rules and monitoring.
Retail
Here at PCG, we pride ourselves in helping you balance inventory, tracking, ordering and other burdensome, but essential, tasks.
Small Business
At PCG, we recognize that you need expert software development that is concise, affordable and quickly deployed so that you can run your business efficiently.
Transportation
Let us expand your technology to manage, track and control your transportation related services.
our system
FireFlight Data System: A Modular Platform Developed and Maintained Exclusively by PCG
FireFlight Data System is our proprietary modular software platform for environmental compliance, industrial operations, and field data management. Built on .NET Core and SQL Server, the system is hosted and maintained entirely by us. Our clients receive a fully operational system with ongoing engineering support. Infrastructure management, security maintenance, and platform updates remain our responsibility for the duration of the engagement.
See how it works for a specific vertical on our page for manufacturing and industrial operations, or read why teams migrate off spreadsheets and legacy systems.
Waste manifest tracking and regulatory deadline management
Multi-site air permit monitoring and exceedance alerting
Remediation milestone documentation and audit trail management
EPA and state DEP compliance record management
Field inspection data capture and regulatory report generation
PCG-hosted infrastructure with direct engineering support
Can you just ask your operation a question?
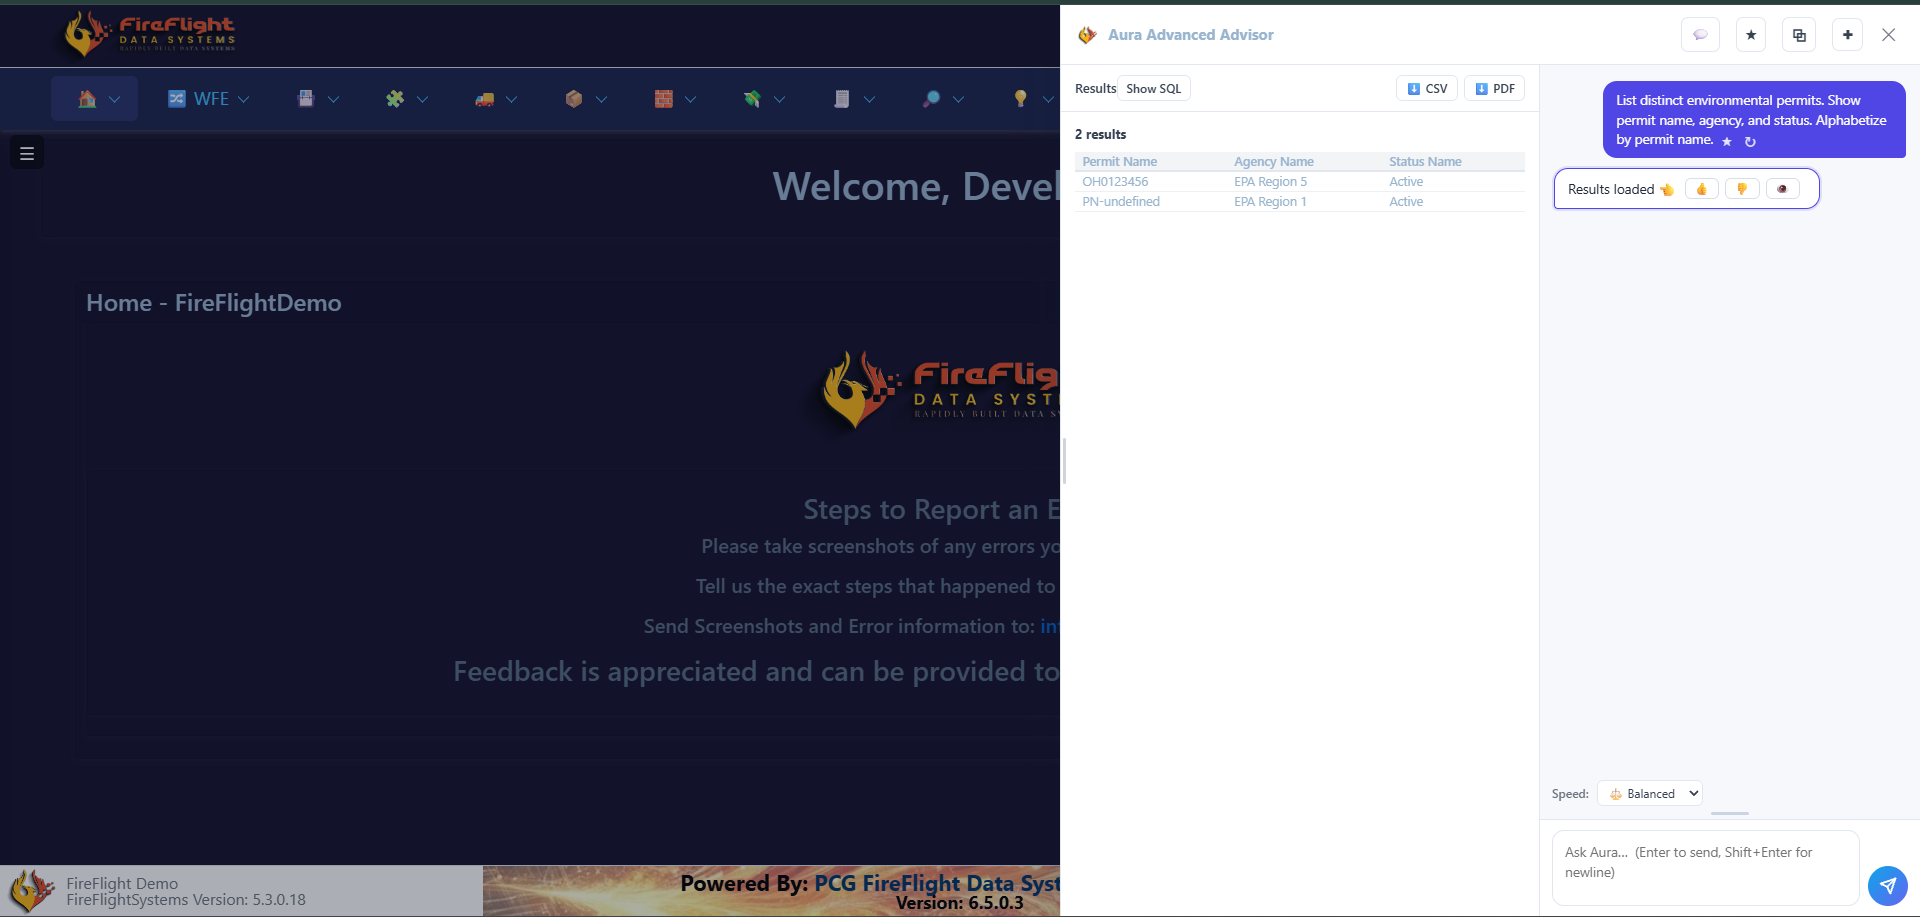
Yes. FireFlight, the operational platform PCG builds and maintains, lets you query your live data in plain English. You do not build a report or export a spreadsheet. You ask, and it returns the matching records, ready to export.
Ask your operation
Answers from your live data, in plain English
No SQL, no report builder. It is built into every FireFlight deployment PCG stands up.
"What compliance obligations are due this month?"
"Show me every work order that is overdue right now."
"Which permits are up for renewal in the next 90 days?"
Every answer comes with Show SQL, CSV, and PDF export on the result.
FAQ
Technical and Commercial Questions Addressed Before Engagement
PCG FAQ Block
Yes. We have maintained and migrated Microsoft Access systems across all versions of the platform since its original release, completing hundreds of migrations to SQL Server, cloud-hosted environments, and modern .NET applications. Access to the original developer is not a requirement for initiating an engagement. The majority of these projects complete within 4 to 12 weeks, with duration determined primarily by the volume of undocumented schema changes accumulated over the system's operational history.
Three technical paths are available. A compatibility shim can defer failure but does not address the underlying architectural incompatibility. A targeted rewrite of the components generating failures is appropriate when the failures are isolated to specific modules. Full migration to .NET Core is the permanent resolution and the approach we recommend for any application that is operationally critical. We have executed all three approaches, with the appropriate path determined by system scope, organizational timeline, and operational risk tolerance.
We initiate a technical reconstruction phase before any migration activity begins. This involves systematic analysis of the existing database schema, codebase, and runtime behavior to produce a documented map of the system's data structures, business logic, and operational dependencies. This phase typically adds one to three weeks to the overall project timeline. We do not proceed to migration without it, because migrating from an incompletely understood system is the primary cause of data loss and business logic failure in legacy migration projects.
FireFlight provides a pre-built platform layer that we configure to meet a client's specific workflow requirements, reducing time-to-production compared to building the platform layer from scratch. A fully custom development engagement is appropriate when the business logic and workflow requirements are complex or specialized enough that no existing platform architecture provides a suitable foundation. We determine the appropriate path during the diagnostic phase.
We have delivered production systems for Fortune 500 organizations including ExxonMobil, as well as for owner-operated environmental consulting firms with fewer than 20 employees. Organizational size is not the primary qualifying criterion. The determining factors are whether the technical requirement falls within our documented scope, whether the project timeline is realistic, and whether a single decision-maker or small team has authority to initiate an engagement.
We maintain all systems we build under a monthly retainer structure covering hosting on our infrastructure, ongoing platform maintenance, direct engineering support via telephone, authorized minor system modifications, and platform updates. Technical issues are typically resolved within hours of the initial contact, because the engineer receiving the call has direct working knowledge of the system's architecture. There is no intermediary support tier and no escalation requirement.