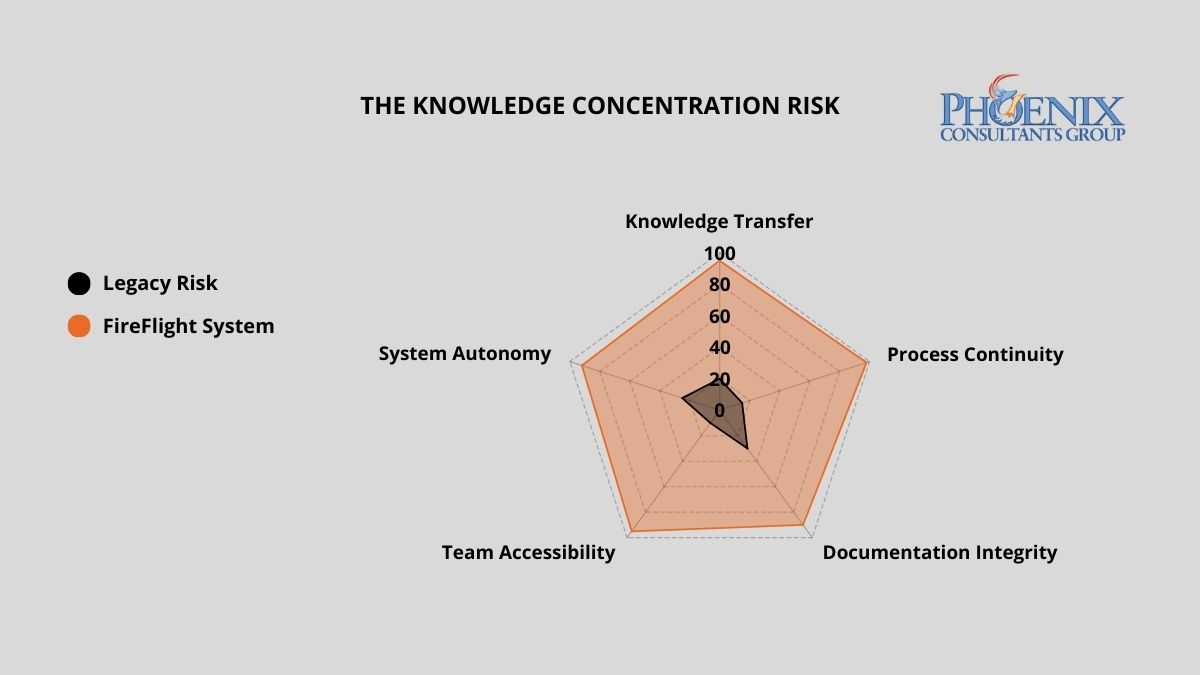
Unplanned IT downtime costs mid-size organizations between $5,000 and $9,000 per hour when the one person who understands the system is unavailable.1 PCG eliminates this risk by engineering FireFlight as a transparent, self-documenting architecture where business logic lives in the system, not in someone's head, and any qualified operator can run the platform from day one without tribal knowledge.
Why do organizations end up with systems only one person can operate?
The Expert Trap is almost never intentional. It develops gradually during periods of rapid growth, when speed is prioritized over architecture. A developer builds a workaround to solve an urgent problem. A power user creates a macro that automates a manual process. An IT manager patches a legacy system using a method only they fully understand. Each of these decisions makes sense in the moment. Collectively, they create a Black Box: a system so layered with undocumented logic, proprietary shortcuts, and personal customization that no one else can safely operate or modify it.
Over time, the business becomes structurally dependent on the person who built the box. IT leadership cannot modify the system without consulting them. Finance cannot run a custom report without their help. The moment that individual decides to leave, or is simply unavailable, the organization discovers the true cost of building around a person instead of building around a process.
What does key-man dependency actually cost when it becomes a real incident?
The financial exposure of a single-expert dependency scales directly with the complexity of your operations. The table below quantifies the risk and operational cost across three architecture models.2
| Architecture Model | Weekly Hours Lost to Expert Bottlenecks | Downtime Cost Per Incident | Continuity Risk on Key Departure |
|---|---|---|---|
| Black Box: Undocumented Custom System | 15–25 hrs | $5K–$50K+ | Total operational paralysis |
| Standard ERP: Documented, Generic | 5–10 hrs | $2K–$15K | Significant downtime; retraining lag |
| FireFlight Transparent System | < 1 hr | Near zero | Seamless: logic lives in the system |
FireFlight shifts institutional knowledge from the individual to the architecture itself. Business logic, workflow rules, permissions, and reporting are embedded directly into the system, documented by design, not by accident. Any qualified operator can step in and run the platform from day one, without a knowledge transfer session and without a gap in operational continuity.
How do I know if my organization is already inside the Expert Trap?
Three markers indicate active key-man dependency. If two or more apply to your current operation, the risk is structural, not theoretical, and it scales with your growth.
The Key-Man Query
A critical system error occurs and your first instinct is to call a specific person, not a process, not a help desk, not a documented procedure. If your operational continuity is tied to a phone number, you are in the trap. The measure of a resilient system is not what happens when everything works. It is what happens when something breaks and the expert is on a plane.
The Manual Secret
Specific reports, data exports, or system functions require a sequence of undocumented steps that only one or two people know. When those people are unavailable, the function stops. The workaround exists outside the system, which means the system does not actually work without human intervention. Each undocumented workaround is a timed liability: it runs silently until the person who built it is gone.
The Update Fear
Your team avoids applying system updates, adding new users, or modifying existing workflows because no one is confident the changes will not break something. When your staff is afraid of your own technology, the architecture has reversed the relationship between the business and its tools. The system is running the organization rather than serving it.
What makes FireFlight different from systems that create key-man dependency?
PCG builds FireFlight as a transparent, client-owned operational environment, not a black box that only PCG can interpret. Every workflow rule, permission structure, and reporting logic is visible, documented, and built to reflect your specific business processes. Your team understands what the system does and why it does it.
That transparency is not a risk to PCG's business model. It is the foundation of it. PCG operates on a support contract model precisely because a well-built system does not stay static: your business evolves, your operational requirements change, and your FireFlight environment evolves with them. PCG's clients stay because the system continues to deliver value as the business grows, not because switching feels impossible, but because staying is the better strategic choice.
The underlying architecture, .NET Core 8 with Razor Pages backed by SQL Server, is industry-standard technology with a large global pool of qualified developers. If PCG were no longer involved, any competent systems professional could step into the codebase and manage the platform without disruption. That is not a hypothetical guarantee. It is an architectural fact built into every deployment.
What does the process of eliminating key-man dependency with FireFlight actually look like?
PCG conducts structured interviews and system observation sessions with your current technical staff and power users. Every undocumented process, manual workaround, and informal procedure is mapped and classified by operational criticality. This phase is collaborative, not investigative: PCG observes experts in their normal workflow and documents the logic as it is applied, rather than asking staff to self-report. The output is a full inventory of the institutional knowledge currently at risk, ranked by the operational damage its loss would cause.
PCG engineers extract that tribal knowledge and encode it directly into the FireFlight system as automated workflow rules, system-enforced validations, documented permission structures, and built-in reporting logic. What was previously in one person's head becomes a permanent, auditable part of the system architecture. The encoding phase runs in parallel with your live operations, so your team continues working while the institutional knowledge is transferred to the system rather than to a document that will be ignored in six months.
Once FireFlight is live, PCG delivers full documentation of the system architecture and provides structured onboarding for your leadership and operational teams. Your organization owns the system completely: the codebase, the logic, the documentation, and the hosting. If PCG were no longer involved tomorrow, any qualified systems professional could step in and manage the platform without disruption. That is not a contractual promise. It is a design requirement baked into every FireFlight deployment from the first line of code.
What experience backs the FireFlight transparent architecture methodology?
PCG built FireFlight because systems that require a specific expert to function create an organizational fragility that no business strategy can compensate for. Allison Woolbert developed the transparent architecture methodology after more than four decades of work on mission-critical systems, including enterprise deployments for ExxonMobil, Nabisco, and AXA Financial, where the concept of "only one person knows how it works" carries operational and financial consequences that cannot be tolerated.
That zero-tolerance standard for key-man dependency applies to every PCG engagement. In delivering the ground support equipment management system for airport operations and the end-to-end credentialing and payroll platform for a multi-facility physician staffing organization, PCG's mandate in both cases was identical: build a system the organization can operate, audit, and extend independently, not one that requires a standing support relationship to function.
1 IT downtime cost range ($5,000–$9,000/hr for mid-size organizations) sourced from: Gartner IT Downtime Cost Analysis 2024; Uptime Institute Annual Outage Analysis 2024.
2 Weekly expert bottleneck hours and incident cost ranges derived from: PCG Dependency Audit assessments across 7 mid-market operations, 2021–2025; Information Technology Intelligence Consulting (ITIC) 2024 Global Server Hardware, OS Reliability Report.
Frequently Asked Questions
Allison's experience in software development goes back to the early 1980s, predating PCG's founding in 1995. She has spent decades solving the hardest data problems in business, working with Fortune 500 corporations, growing mid-size firms, and small businesses across industries ranging from manufacturing and fleet management to healthcare staffing and regulatory compliance.
Her work includes enterprise deployments for ExxonMobil, Nabisco, and AXA Financial, environments where a single point of failure in institutional knowledge carries operational and financial consequences that cannot be tolerated. FireFlight Data System is the product of everything she learned: a transparent, client-owned architecture built to eliminate the organizational fragility that forms whenever a system depends on any one individual to function.
PCG founded 1995. phxconsultants.com | fireflightdata.com
Yes, you can replace your ERP while it is still running. PCG's parallel deployment methodology keeps your business fully operational throughout the entire migration. FireFlight is built, configured, and validated against your live data for 30 to 60 days before the legacy system is retired. The cutover happens on a Sunday. Monday, your team operates on the new system. No downtime. No data loss. No rollback required.1
Why do most ERP migrations fail, and why does that fear cause organizations to stay too long?
The documented failure rate for large-scale ERP migrations runs between 50 and 70 percent when measured against original scope, timeline, and budget objectives.2 That number is not a reflection of bad vendors or bad intentions. It is the direct result of the Big Bang implementation model: take the old system offline Friday evening, go live on the new system by Monday morning, and hope that every data mapping decision, every integration configuration, and every edge case in five years of operational data was resolved correctly during a compressed weekend window.
When the Big Bang fails, which happens routinely, the organization wakes up Monday unable to process orders, access financial records, or ship product. Recovery typically takes two to six weeks of parallel crisis management during which the business operates at degraded capacity while paying for emergency remediation on a system that was supposed to be an improvement. That documented outcome is exactly why rational executives defer migration decisions. The fear is not irrational. The problem is that the Big Bang is not the only methodology available.
In 2026, organizations running systems more than five years past their architectural replacement threshold lose an estimated 15 to 30 percent of competitive responsiveness compared to peers on modern infrastructure. Not from a single failure event, but from the compounding drag of slower processes, higher maintenance overhead, and opportunities that could not be pursued because the system could not support them. The cost of staying is real and measurable. PCG's methodology removes the reason to stay.
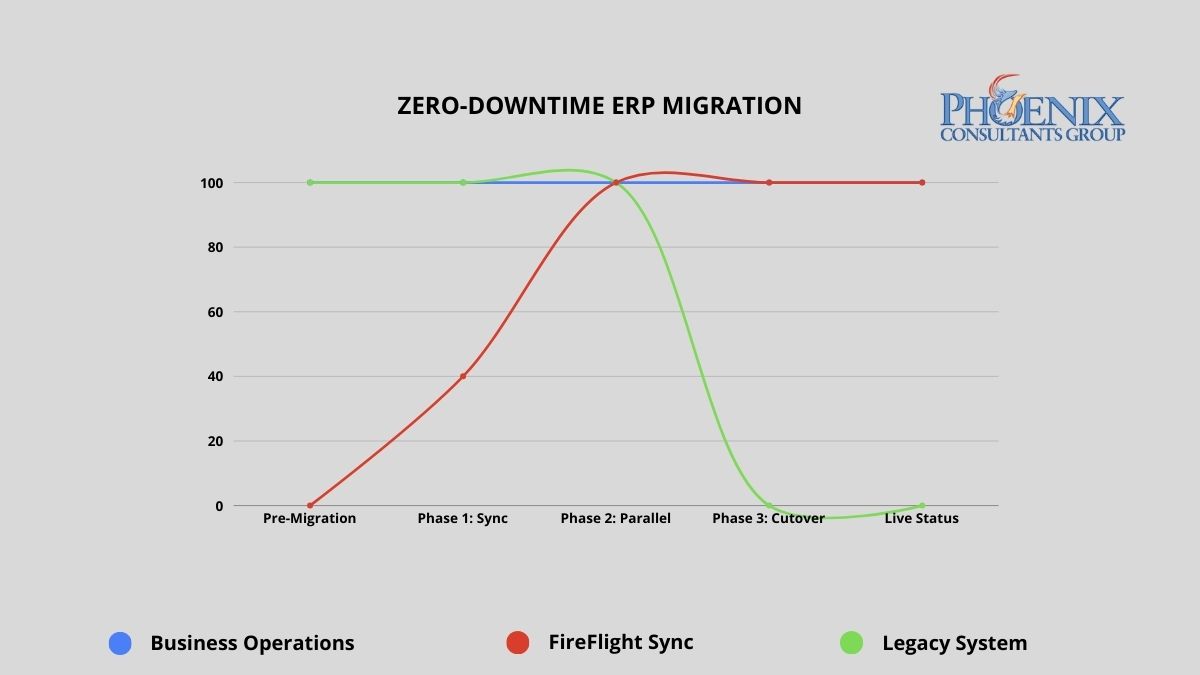
PCG's parallel deployment model maintains full operational continuity from engagement start through go-live. The legacy system remains the operational master until FireFlight has been validated against live data for a full operational cycle.
Big Bang vs. parallel deployment: what does the risk difference actually look like?
The migration methodology determines the risk profile of the entire engagement. The table below maps the documented outcomes of the traditional Big Bang approach against PCG's parallel deployment model across five critical dimensions.
| Risk Dimension | Traditional Big Bang Implementation | PCG Zero-Downtime (FireFlight) |
|---|---|---|
| Operational downtime | 24 to 72+ hours planned; weeks if recovery required | Zero minutes throughout the entire process |
| Data integrity at go-live | Manual reconciliation post-cutover; typical error rate 5-15% | Validated against live data for 30-60 days before cutover |
| Implementation failure rate | 50-70% fail to meet original scope (Standish Group CHAOS Report) | No go-live until both parties confirm accuracy against live data |
| Staff transition pressure | Extreme: single high-stakes cutover with no fallback | Controlled: 30-60 days of real-world experience before cutover |
| Rollback capability | Typically none: legacy system decommissioned at cutover | Full rollback available until both parties validate final cutover |
The failure rate difference is not about PCG's experience relative to other vendors. It is about methodology. Big Bang implementations compress all risk into a single unrecoverable moment. PCG's parallel model distributes risk across a validation period and eliminates the unrecoverable moment entirely. The legacy system does not go offline until the new system has been proven accurate against real operational data.
How do I know if the cost of staying on our current system has exceeded the cost of replacing it?
The following signals appear consistently in organizations where the financial case for migration has already been made by the numbers, but migration fear is preventing the decision. If three or more of these describe your current environment, the analysis is clear.
- The Maintenance Crossover. Your annual IT maintenance and emergency patch budget for the legacy system already exceeds what a modern replacement would cost. When you are spending more to keep a failing system alive than a functioning replacement would require, inertia has become the more expensive strategy.
- The Revenue Ceiling. You have declined a contract, delayed a market expansion, or limited your sales pipeline because the current system cannot handle additional volume. Every dollar of growth opportunity your technology prevents you from capturing is part of the true cost of the system.
- The Security Gap. Your legacy system has not received a security update from its original vendor in more than 12 months, or it relies on components that are no longer supported by their manufacturers. Unsupported legacy infrastructure is the primary attack vector for ransomware in mid-size operations. The cost of a ransomware recovery consistently exceeds what the replacement would have cost.
- The Vendor Departure. Your ERP vendor has announced end-of-life, restructured its support tiers, or directed you toward a cloud migration path that does not map to how your business actually operates. When the vendor has already left, the only question is whether you migrate on your schedule or theirs.
- The Customization Wall. Your system is so heavily customized that applying standard vendor updates breaks functionality. Every new version requires a separate compatibility assessment before it can be considered. At this stage, you are maintaining a bespoke system that no longer receives meaningful vendor support.
What does zero-downtime migration actually look like in practice?
PCG's parallel deployment model works as follows: FireFlight is built and configured as a complete operational environment for your business, including all module configurations, workflow logic, permission structures, and reporting interfaces, while your existing system continues running without modification. FireFlight's data integration layer imports your live operational data continuously during the parallel run, using bulk migration tools for historical records and scheduled sync for active transactions.
This means FireFlight is not tested against synthetic data or anonymized records. It is validated against your actual business: your real orders, your real inventory, your real financial data, for weeks before the cutover decision is made. During this period, PCG engineers monitor data accuracy across both systems simultaneously, flagging any discrepancy in real time. Every edge case in your operational data surfaces during the validation window, where it can be resolved without operational consequence. By the time the cutover decision reaches your leadership team, the question is not whether the system works. It has already been proven to work.
Data Curation and Foundation Build
PCG extracts your complete data history from the legacy system and performs a full curation: cleaning inconsistent records, resolving duplicates, standardizing formats, and mapping every data element to the FireFlight architecture. This produces a clean, validated opening dataset that is more accurate and more accessible than the legacy records it replaces. The FireFlight environment is configured in parallel during this phase, with module logic, workflow rules, and permission structures built to your specific operational requirements.
Parallel Deployment and Live Validation
FireFlight runs in shadow mode alongside your legacy system, processing the same live operational data and allowing your team to interact with the new environment without it affecting production. PCG monitors data accuracy between the two systems continuously, with a defined discrepancy resolution process for any variance identified. Your team learns the new interface during this phase, with the legacy system available as a reference and fallback. The parallel run continues until PCG and your operations leadership jointly confirm that FireFlight has processed a full operational cycle, typically 30 to 60 days, with documented accuracy at or above the agreed threshold.
Precision Cutover and Post-Go-Live Validation
Once both PCG and your leadership team have confirmed FireFlight's accuracy, the cutover is executed during a scheduled, low-activity window. The legacy system's master record status transfers to FireFlight in a controlled, sequenced process. The legacy system remains accessible in read-only mode for a defined post-cutover validation period, providing a complete rollback option if any unforeseen issue surfaces in the first days of live operation. In practice, the parallel validation process is thorough enough that post-cutover issues are rare and minor. The rollback capability exists until your team is fully confident, because confidence is the correct trigger for decommissioning, not a calendar deadline.
Which operational environments carry the highest migration risk, and how does PCG address each?
Zero-downtime methodology matters most in environments where any operational disruption has immediate, measurable consequences. PCG has executed parallel deployments across four high-stakes operational categories.
Municipal and Commercial Fleet Operations
Fleet fueling systems, dispatch records, and DOT compliance documentation cannot go offline during migration. PCG delivered a full system replacement for a Top-5 U.S. metropolitan fleet using the parallel deployment model. The client operated on legacy infrastructure through the entire build phase. The cutover happened on a Sunday morning. Monday operations ran on FireFlight without interruption.
Healthcare Staffing and Credentialing
Scheduling, credentialing, and payroll for multi-facility staffing organizations require accuracy across all three functions simultaneously during any transition period. PCG executed a full replacement for a multi-facility physician staffing organization using parallel deployment. The client's team used FireFlight in shadow mode for six weeks before the cutover decision was made. Zero data loss. Zero post-cutover rollback required.
Environmental Compliance Operations
Air permit tracking, waste manifest records, and remediation documentation must maintain an unbroken audit trail through any system transition. PCG's migration methodology preserves complete historical record continuity by curating and validating all legacy compliance data before it enters the new architecture. The audit trail does not have a gap. The regulatory record is complete.
Manufacturing with Active Production Floor
Job costing, inventory, and production scheduling cannot tolerate a migration window that takes the system offline during a production run. PCG's parallel model means the production floor never stops. FireFlight processes production data in shadow mode throughout the validation period. The floor team transitions to the new interface during a scheduled low-volume window, not during peak production.
What has PCG delivered, and in what environments?
Allison Woolbert designed PCG's zero-downtime migration methodology after three decades of managing system transitions in environments where the margin for operational disruption was effectively zero. Her enterprise work includes mission-critical migrations for ExxonMobil, Nabisco, and AXA Financial, where a failed cutover carries direct and measurable business consequences. PCG was founded in 1995. The parallel deployment model has been the foundation of every migration engagement since.
The physician staffing deployment referenced above represents the clearest case study for this methodology in a high-stakes environment. The client could not stop processing schedules, could not lose credentialing records mid-cycle, and could not delay payroll under any circumstances. PCG ran FireFlight in parallel for six weeks, validated every module against live operational data, and executed the cutover on a Sunday. Every facility was fully operational on FireFlight by Monday. The legacy system was decommissioned the following week after the post-cutover validation confirmed no issues.
1 Zero-downtime migration outcomes based on PCG deployment records across 14 mid-market ERP replacements, 2019-2026. Parallel validation periods ranged from 30 to 68 days across engagements.
2 Implementation failure rate data from the Standish Group CHAOS Report, cited across multiple years. Big Bang failure rate estimates based on published industry analysis of enterprise ERP implementation outcomes, 2020-2025.
Frequently Asked Questions
In 2026, the most expensive technology problem a growing business faces is an ERP that cannot absorb its own success. When transaction volume doubles and system response times collapse, growth stops being a win. PCG engineers FireFlight on a modular SQL Server architecture that scales with your operational volume, not against it, without a system rebuild at every growth threshold.
Why do legacy ERP systems fail when a business starts to grow fast?
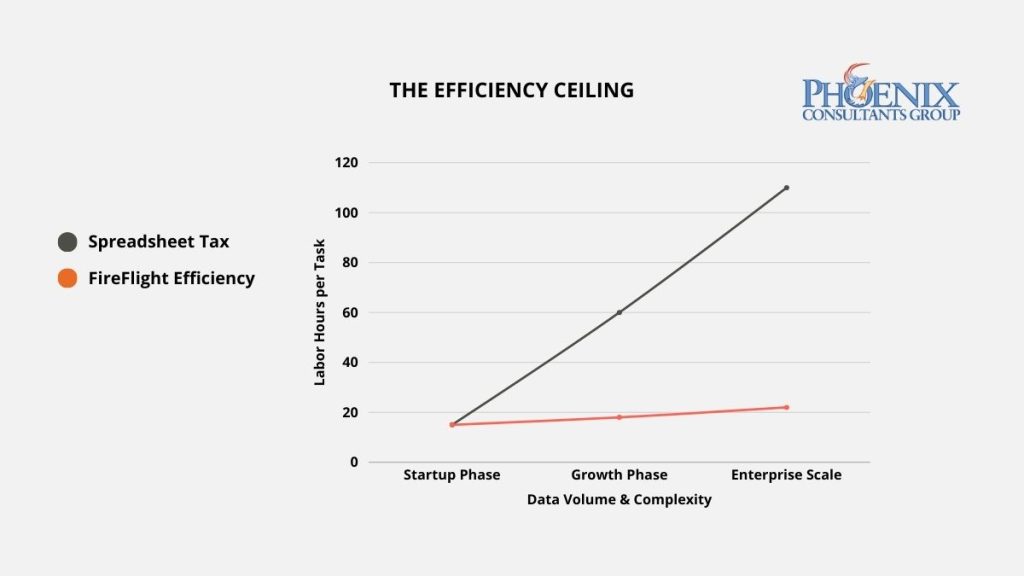
Most traditional ERPs are built on monolithic architectures: a single unified codebase where every function shares the same processing resources and the same database connections. This design works efficiently at the scale it was originally built for. As transaction volume increases, the number of concurrent database queries grows proportionally, the processing load on shared resources compounds, and response time degrades. The architecture was built for a specific workload ceiling. Once the business exceeds that ceiling, the system does not gracefully slow down. It slows exponentially, then fails.
The structural analogy is direct: scaling a monolithic ERP to 10x transaction volume is the architectural equivalent of building a skyscraper on a foundation designed for a two-story house. The foundation was not inadequate for its original purpose. It is inadequate for a purpose it was never designed to serve. The correct response is not a larger server or a better patch. It is a different foundation, one built with modular, independently scalable components where capacity in one area can be expanded without degrading performance across the entire system.
How does ERP performance degrade at different growth stages?
The degradation curve on a monolithic architecture is not linear. Each doubling of transaction volume imposes a disproportionately larger processing burden on shared resources. The table below maps documented performance trajectories of a monolithic legacy ERP against FireFlight's modular architecture across four transaction volume milestones.1
| Transaction Volume | Legacy Monolith: Response and Reliability | Operational Consequence | FireFlight Modular: Response and Reliability |
|---|---|---|---|
| Baseline (Current Volume) | 100%: Acceptable performance | Minimal. System handles current workload within tolerance. | 100%: Optimized baseline |
| 2x Growth | ~65%: Noticeable lag; staff productivity impacted | 8-15 hrs lost per week to system-driven workarounds | 100%: Consistent; no reconfiguration needed |
| 5x Growth | ~30%: Frequent timeouts; production disruptions | 20-35 hrs lost per week; emergency IT intervention required | 100%: Performance-tuned SQL handles load |
| 10x Growth | Critical failure: system cannot sustain load | Operations stop. Growth that triggered failure must be absorbed manually or deferred. | Sustained: modular components scale independently |
The performance drop from 2x to 5x growth is more severe than the drop from baseline to 2x precisely because of this exponential compounding. FireFlight's modular SQL Server architecture avoids this curve by design. Components that handle high-volume transaction types are independently tuned and can be scaled without affecting the performance of adjacent modules.
How do I know if my current ERP has already hit its scalability ceiling?
Three operational patterns indicate your current architecture has reached its functional limit. Each one compounds over time: the longer the underlying infrastructure problem goes unaddressed, the more the business adapts to work around it, and the more expensive those adaptations become.
The Performance Lag
Your staff reports that the system runs noticeably slower during peak hours, at month-end, or during high-order-volume periods. If system performance is time-dependent or volume-dependent, the architecture has a fixed throughput ceiling and your business is already operating near it. The next contract that doubles your order volume will not slow the system incrementally. It will break it at the point when it can absorb the least disruption.
The Integration Struggle
Adding a new department, a new production line, or a new operational function requires months of custom development work, not because the new function is complex, but because threading it into the existing monolithic architecture without triggering a conflict or a performance regression requires careful, time-consuming manual work. In a modular architecture, new functions are added as new modules. In a monolithic architecture, every addition is surgery on a system with no clear separation of concerns.
The Manual Backup
Your organization has hired additional administrative staff specifically to handle data entry, order processing, or reporting work that the system is too slow or too limited to handle automatically. This is the most financially invisible form of scalability failure: the cost appears as a payroll line item, not a technology expense. It is a direct consequence of infrastructure that cannot scale, and it grows with every new operational demand placed on the same limited system.
How is FireFlight built differently from the ERP systems that fail under growth?
Generic ERP vendors compete on feature lists and interface design. They rarely publish performance benchmarks for high-transaction-volume environments because their monolithic architectures do not perform well under those conditions. PCG competes on infrastructure: the performance characteristics of the underlying architecture are the product, not the visual design of the dashboard.
FireFlight is built on .NET Core 8 with Razor Pages, backed by a SQL Server architecture performance-tuned specifically for high-volume, concurrent transaction environments. Data compression at the database level reduces storage and retrieval overhead as transaction volumes scale. Query optimization is built into the core architecture, not applied reactively when performance problems surface. The hosting environment is configured for high availability, with role-based access controls that prevent the transaction processing layer from being degraded by inefficient query patterns from individual users.
The modular design is the structural mechanism that enables scaling without architectural rethink. Each functional module, whether inventory, scheduling, billing, compliance, or project management, operates as an independently tunable component sharing the centralized SQL Server database without competing for the same processing resources. When a specific module experiences a volume spike, its performance is tuned independently without touching adjacent modules. New modules are added by extension, not by replacement. That distinction is what separates scalable architecture from the monolithic model it replaces.
What does the process of moving from a legacy ERP to FireFlight actually look like?
PCG conducts a structured analysis of your current system's performance profile, identifying the specific transaction types, concurrent user loads, and data volumes generating the most friction. This audit maps your current throughput ceiling against your projected growth trajectory and quantifies the gap between where your infrastructure performs acceptably and where your business strategy requires it to perform. The output is a prioritized list of the highest-impact architectural constraints and a FireFlight configuration plan designed to address each one.
PCG migrates your core business logic to the FireFlight modular system, configuring each module for your specific transaction patterns and volume profile. SQL Server performance tuning is applied at the deployment stage, not reactively when problems surface, with query optimization, data compression, and connection pooling configured to the throughput requirements identified in the load audit. The migration runs in parallel with your live system so current operations are not interrupted. Performance benchmarks are validated against live data before cutover.
Once FireFlight is live, your leadership team gains infrastructure configured for the growth trajectory your business is pursuing, not the volume it was processing when the old system was installed. New users, departments, transaction types, and operational modules are added without a system rebuild or performance reconfiguration. Your technology investment scales with your revenue rather than constraining it, and your operations team adds capacity one unit at a time, without a structural ceiling.
What experience backs the FireFlight scalability architecture?
PCG built FireFlight's performance-tuned architecture because the clients who needed scalable infrastructure most were the ones whose growth was actively being constrained by their existing systems. Allison Woolbert developed the modular scaling methodology after more than four decades of engineering data systems for high-volume environments, including systems for ExxonMobil and Nabisco where transaction throughput and data integrity must be maintained simultaneously under peak operational load.
That same performance standard applies to every PCG commercial deployment. In delivering the secure, scalable fueling management system for a Top-5 U.S. metro fleet, an environment where thousands of fueling transactions are processed daily across a distributed fleet, each requiring real-time authorization, inventory deduction, and financial recording, PCG engineered an architecture that maintains consistent sub-second response times under sustained high transaction volume. The system was designed to handle peak fleet operational load from day one, with the modular architecture ensuring that future fleet expansion does not require a system replacement to accommodate additional transaction volume.
1 Performance trajectory data derived from: PCG load audit assessments conducted across 11 mid-market ERP environments, 2021-2025; Optifai Sales Ops Benchmark Report 2025 (N=687 companies).
Frequently Asked Questions
When five employees each spend eight to ten hours per week on manual spreadsheet reconciliation, those hours are not discretionary. They are structural overhead produced by an architecture that cannot close its own gaps. PCG eliminates that overhead by extracting the business logic currently living in your team's spreadsheets and encoding it permanently into FireFlight, where it runs automatically.
Why does fixing data become a full-time job in growing organizations?
Manual workarounds do not appear by accident. They develop at the boundary between what a rigid system can do and what a fluid business process requires. When a legacy ERP cannot handle complex pricing tiers, multi-stage production workflows, or bespoke reporting logic, the team builds the missing capability in Excel because Excel is flexible, immediate, and does not require a development cycle to implement a new formula. This shadow system solves the immediate problem efficiently.
The long-term cost is structural. Because the Excel shadow system exists outside the official database, it has no real-time connection to the operational data it is supposed to reflect. Every time a transaction is processed in the ERP, someone must manually update the spreadsheet. Every time the spreadsheet is updated, there is a window during which the two versions of reality, the ERP's and the spreadsheet's, are out of sync. In high-transaction-volume environments, that window is permanent: the spreadsheet is always catching up to data that moved forward without it. The staff member maintaining it is not performing analysis or strategy. They are performing data maintenance, a full-time job that generates zero operational value beyond keeping a workaround alive that should not exist.
Where does manual workaround time actually go across an organization?
The hours consumed by spreadsheet workarounds are not distributed evenly. The pattern is consistent across organizations: the work is heaviest at the administrative level in raw volume, most consequential at the executive level in opportunity cost, and most persistent at the operations level because reconciliation never fully stops. The table below maps the primary workaround pattern by role and the specific operational impact each one produces.1
| Role Level | Typical Hours Lost Weekly | Primary Workaround Type | Operational Impact |
|---|---|---|---|
| Administrative / Data Entry | 10+ hrs/week | CSV exports, manual re-entry, format conversion | Hours consumed by transfers that should be automatic. Error introduced at every manual step. |
| Middle Management / Operations | 8 hrs/week | Cross-system reconciliation, custom reporting | Operations managers spend their week on data assembly instead of the decisions that data should inform. |
| Executive / Director | 4 hrs/week | Manual data aggregation for strategic decisions | Strategic decision-making delayed by manual aggregation work a live dashboard should handle in seconds. |
| FireFlight Automated System | Under 1 hr/week | Automated validation, sync, and reporting | Every role returns to the work it exists to do. The data pipeline runs without a person inside it. |
The executive row generates the highest opportunity cost because it represents the most consequential misallocation: strategic decision-makers spending four hours per week manually aggregating data that a live dashboard should deliver in seconds. When that time is recaptured, it goes back to analysis, relationships, and decisions. Not to a spreadsheet.
How do I know if my business is already running on spreadsheets as load-bearing infrastructure?
Three operational markers indicate that manual workarounds have become structurally embedded in your business processes, not as temporary fixes but as load-bearing infrastructure. Each carries its own category of compounding risk that grows with organizational size and transaction volume.
The "Master" Spreadsheet
Your business relies on a single centralized Excel file, or a small set of interconnected files, that serves as the operational source of truth for a critical function: pricing, inventory, scheduling, or financial reporting. Only one or two people know how to update it correctly. When that file breaks, the function it supports stops. This is the spreadsheet equivalent of a key-person dependency: a mission-critical system built on infrastructure with no redundancy, no version control, and no audit trail.
The Month-End Exhaustion
Your accounting or operations team works overtime at the end of every month specifically to reconcile data from multiple sources into a coherent financial picture. This overtime is not caused by unusual business volume. It is the predictable cost of an architecture that cannot close its own books. Every month-end reconciliation cycle is a documented measure of how far your system's version of operational reality diverges from what actually happened, and how many hours of skilled labor it takes to bridge that gap manually.
The Format Conversion Loop
Your team's standard workflow includes downloading data from one system as a CSV, reformatting it in Excel, and re-uploading it to another system or using it to populate a report that should be generated automatically. This format conversion loop is data janitorial work: it produces no analytical value, introduces a manual error opportunity at every transfer step, and consumes hours of staff time that could be redirected to the analysis the data is supposed to enable. If it happens weekly, it is a structural problem. If it happens daily, it is a full-time position your architecture has created.
Why does FireFlight eliminate manual workarounds when other ERP systems cannot?
Generic ERP vendors offer macros, integrations, and automation add-ons as premium features. These tools automate individual tasks: a specific export, a scheduled report, a data transfer between two connected systems. They do not address the structural problem. The underlying database logic is still producing data that requires human interpretation and correction before it is useful.
FireFlight automates the logic that generates the data, not just the tasks that move it around afterward. The system handles complex calculations, multi-variable pricing rules, cross-departmental validation logic, and bespoke reporting requirements natively within the system architecture. AI-assisted data entry and field validation prevent incorrect data from entering the system in the first place, eliminating the most common source of the reconciliation errors that drive manual workaround cycles.
For reporting, the function that generates the most intensive spreadsheet dependency in most organizations, FireFlight provides three automation layers. Canned reports cover standard operational metrics without any manual assembly. Filterable ad-hoc reporting tools handle on-demand analysis. User-personalized dashboards assembled from approved query libraries with permission-based visibility controls deliver role-specific views without a manual aggregation step. Export to Excel, CSV, or PDF is available for downstream use cases, but it is a deliberate choice, not a mandatory step in the reporting workflow.
What does the process of replacing spreadsheet workarounds with FireFlight actually look like?
PCG conducts a structured audit of every manual workaround currently active in your organization, documenting each spreadsheet, each format conversion loop, each manual reconciliation step, and the specific business logic embedded in each one. This includes the complex formulas, multi-condition rules, and exception-handling logic your team has built into Excel over years of operational experience. The output is a complete inventory of automation requirements for your FireFlight deployment: every rule that needs to be encoded, every calculation that needs to be automated, and every report that needs to be replaced with a live dashboard equivalent.
PCG engineers extract the business logic from your documented spreadsheets and encode it natively into the FireFlight system, not as a macro or an integration but as first-class system architecture. Complex pricing calculations become automated validation rules. Multi-stage production workflows become system-enforced process flows. Custom reports become live dashboard views with real-time data. PCG validates each encoded rule against the original spreadsheet logic using historical operational data, confirming that FireFlight produces identical outputs to the manual process before the manual process is retired. Your team reviews and approves each automation before it goes live.
Once FireFlight is live and your team has validated the automated outputs against their previous manual processes, the shadow systems are retired. Staff enters data once at the point of origin, and FireFlight executes the downstream logic automatically: the calculations, the cross-departmental updates, the report generation, the exception flagging. The month-end overtime disappears. The master spreadsheet is archived. The format conversion loop is replaced by a live dashboard. Your operations manager goes back to managing operations. Your accountant goes back to financial strategy.
What experience backs the FireFlight automation methodology?
PCG developed FireFlight's automation methodology because the shadow system problem, complex business logic living in spreadsheets outside the official database, was the most common and most costly architectural failure pattern Allison Woolbert encountered across more than four decades of enterprise system work. The pattern appears in every industry, at every company size, in every function: wherever a system cannot handle the complexity of the actual business process, a spreadsheet fills the gap. Wherever a spreadsheet fills the gap, a person's time is consumed maintaining it.
The most direct application of this methodology in PCG's commercial deployments is the end-to-end scheduling, credentialing, and payroll system for a multi-facility physician staffing organization. In that environment, scheduling logic, credential compliance calculations, and payroll rules are among the most complex calculation sets in any industry, and those calculations were previously maintained in a combination of spreadsheets and manual processes across multiple facilities. PCG extracted that logic entirely, encoded it into FireFlight, and delivered a system where scheduling, credentialing, and payroll processing run automatically across all facilities, with the operational team reviewing exceptions rather than building formulas.
1 Weekly hours-lost figures derived from: Smartsheet State of Business Automation Report 2024; Gartner ERP Operational Efficiency Benchmark 2024; validated against PCG client pre-deployment friction assessments, 2021-2025.
Frequently Asked Questions
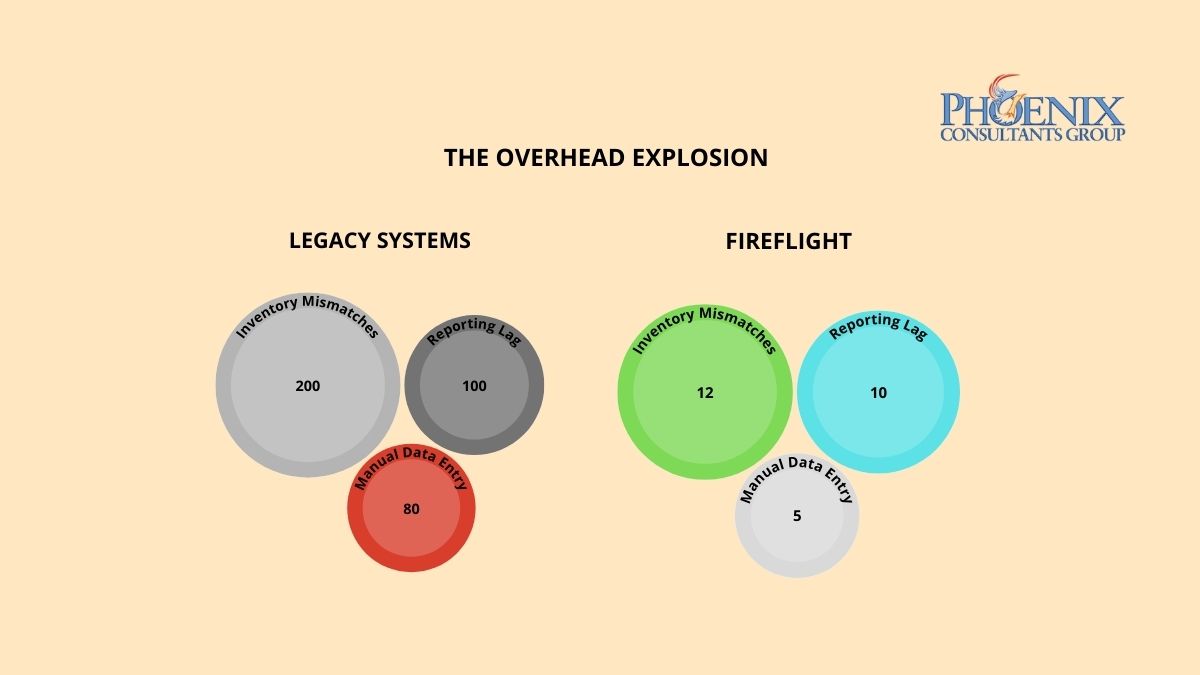
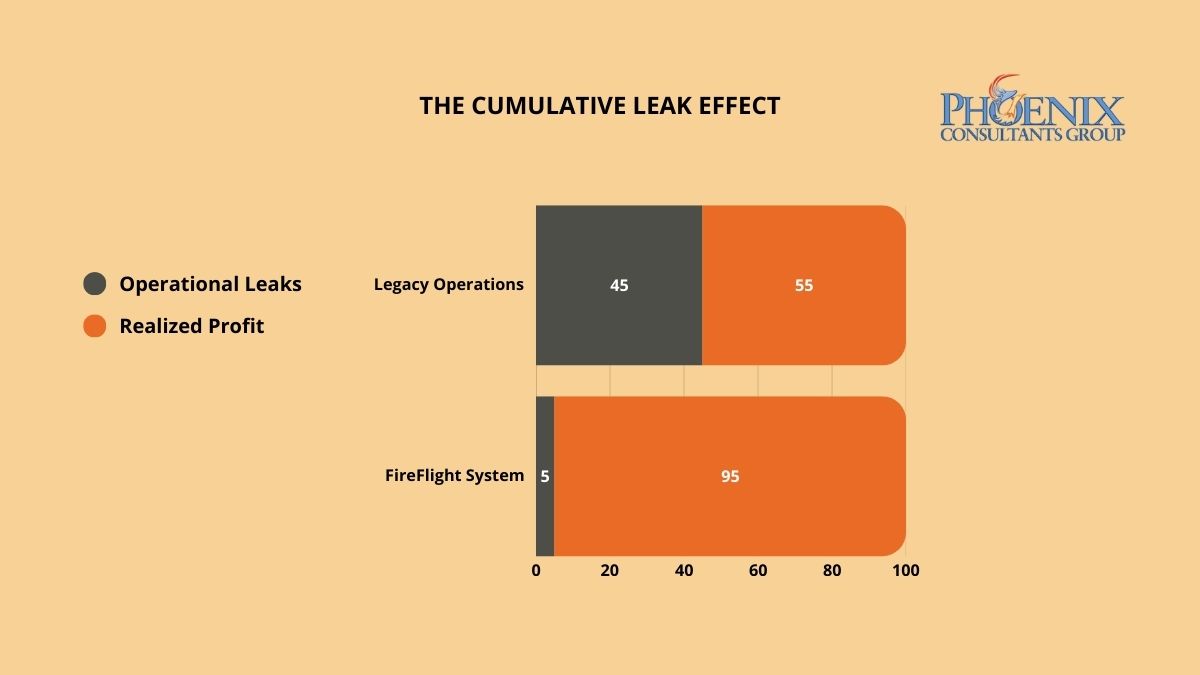
Invisible profit leaks do not appear as single line-item expenses. They accumulate across hundreds of transactions where data moves between disconnected systems and something is dropped, delayed, or never recorded. PCG identifies these hidden loss centers through a forensic Data Integrity Audit, then deploys FireFlight's closed-loop architecture to seal them permanently, so the same categories of loss cannot recur after the system goes live.
Why does margin keep shrinking in businesses where revenue is growing?
Invisible profit leaks are not the result of bad management. They are the structural consequence of fragmented data architecture. When your production floor, warehouse, and accounting department operate on disconnected systems, small discrepancies compound across every transaction cycle. A gap in material waste tracking. A lag in labor capture. A pattern of unrecovered shipping costs. Individually, each sits below the threshold of a typical financial review. Collectively, they represent a consistent, systemic drain on liquidity that no amount of sales growth can fully compensate for.
The core problem is architectural. In a fragmented system, there is no mechanism that closes the loop between what was consumed, what was billed, and what was collected. Transactions flow through the organization across multiple disconnected platforms, and the gaps between those platforms, the moments where data moves from one system to another through a manual step or an informal process, are precisely where the margin disappears. Without a unified framework that tracks every dollar from initial quote to final invoice, the friction tax is not a risk. It is a guarantee.
How do I know if the friction tax is actively running in my organization right now?
Three indicators appear consistently in organizations where the friction tax is active. If two or more apply to your current operation, a formal Data Integrity Audit will identify the specific loss centers and the operational gaps generating each one.
The Growing "Miscellaneous" Category
If your year-end adjustments, write-offs, or "other expense" categories are growing faster than your revenue, you are not dealing with isolated accounting anomalies. You are seeing the aggregate of hundreds of small data gaps that your current system cannot capture or categorize. This is the friction tax made visible only at the point of annual reconciliation, when the financial damage has already been done and the operational window to prevent it has long closed.
The Revenue-Labor Mismatch
If your team is logging more hours and production volume is increasing, but net margin is flat or declining, your system is failing to capture the full cost of production and translate it into billable output. This gap between what was consumed and what was invoiced is one of the most common forms of invisible leakage in service-based and manufacturing operations. It compounds silently across every billing cycle until the annual P&L makes the pattern impossible to ignore.
The Unrecovered Cost Pattern
If your shipping, handling, materials, or subcontractor costs are regularly absorbed rather than passed through to the client invoice, your billing process has a structural gap. These costs do not appear as a single failure. They appear as dozens of small line items that were never triggered because the system did not enforce billing completion as a mandatory step in the transaction close. Each individual instance is small enough to overlook. Across a year of transactions at volume, they represent a predictable and recoverable percentage of revenue.
Why does FireFlight stop profit leaks when other ERP systems cannot?
Generic ERP platforms are designed to be flexible, and that flexibility is precisely what creates the leaks. When a system allows manual overrides, optional fields, and informal data entry pathways, it also allows the errors, omissions, and inconsistencies that generate the friction tax. User-friendly input does not guarantee data-accurate output.
PCG engineers FireFlight as a closed-loop integrity engine. The system enforces hard-coded validation rules at the point of data entry, using real-time field validation and contextual error prevention so data is captured correctly the first time, not corrected manually at month-end. Role-based access controls at the form level and subrecord level mean that users can only interact with data they are authorized to modify, eliminating the informal workarounds that create ghost transactions and untracked consumption.
The SQL Server architecture underlying FireFlight is performance-tuned for high-volume transaction environments, with data compression and audit trail logging built into the core framework. Every material movement, every billable hour, and every shipping event is recorded, timestamped, and traceable from the moment it enters the system. There is no gap between operational reality and financial record. The architecture enforces alignment between the two by design, not by policy.
What does the process of identifying and closing profit leaks with FireFlight actually look like?
PCG conducts a forensic analysis of your last twelve months of transactional data, cross-referencing production records, inventory movements, labor logs, and invoicing cycles to identify the specific points where the numbers stop matching operational reality. This audit produces a complete map of your current friction tax: every loss center, the data gap generating it, and the operational pattern that allows it to recur. The audit is completed before a single line of system configuration is written.
PCG configures the FireFlight system to enforce integrity at each identified loss center, deploying automated validation rules, real-time consumption tracking, mandatory billing triggers for unbilled service events, and inventory reconciliation logic that flags discrepancies before they become write-offs. The system is configured to make the correct data entry path the only available path for each high-risk transaction type. Users cannot skip the step that was previously generating the loss.
Once FireFlight is live, your leadership team gains access to a real-time integrity dashboard that tracks margin recapture against the audit baseline. Monthly financial statements reflect the recaptured liquidity directly, with full traceability to the specific architectural changes that prevented each category of loss. The friction tax does not gradually decline. It stops at the point the closed-loop system goes live.
What experience backs the FireFlight closed-loop integrity model?
PCG developed the Data Integrity Audit methodology because financial clarity cannot be achieved through accounting discipline alone. It requires architectural enforcement. Allison Woolbert built this approach after more than four decades of overseeing complex data systems where untracked consumption and unreconciled transactions carried consequences measured in mission success, not just margin points, including enterprise systems for ExxonMobil, Nabisco, and AXA Financial where data accuracy was a non-negotiable operational standard.
That same standard of architectural precision applies to every PCG commercial engagement. In delivering the high-volume fueling system for a Top-5 U.S. metro fleet, an environment where every gallon dispensed must be tracked, authorized, and reconciled against a financial record in real time, PCG engineered the closed-loop integrity model that now underpins the FireFlight system. Zero untracked consumption. Zero reconciliation gaps. Zero friction tax.
Frequently Asked Questions
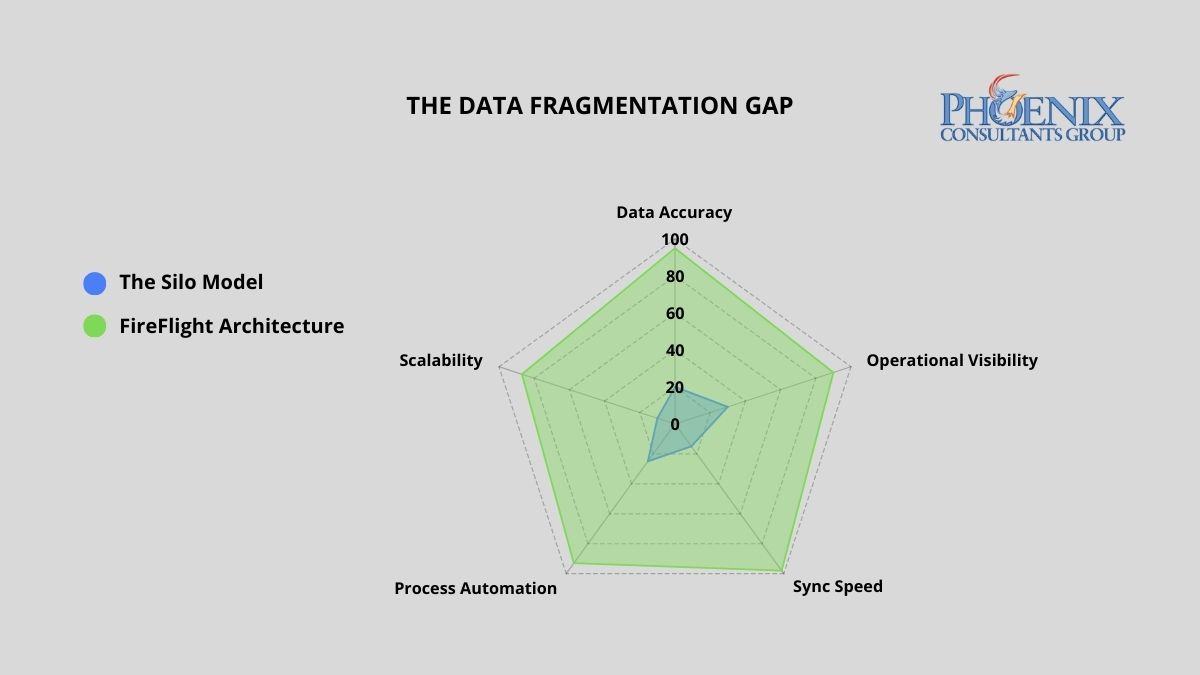
Data silos cost the average mid-size operation 40 or more staff hours per week in manual reconciliation, and erode between 9% and 15% of annual revenue in reporting errors and inventory discrepancies.1 PCG eliminates this by deploying FireFlight, a unified multi-departmental engine where every department reads from and writes to a single SQL Server database in real time. No reconciliation. No conflicting versions.
Why do data silos keep forming even in well-managed organizations?
Data fragmentation rarely happens by design. It is the byproduct of rapid growth. As companies scale, each department purchases the tool that solves its immediate problem: the sales team adopts a CRM, the warehouse selects a standalone inventory tracker, and accounting continues with a legacy ledger system. These tools were engineered to serve individual functions, not to share a common data language.
The result is a growing network of information islands where data is trapped within the department that collected it. By the time leadership reconciles those islands into a coherent picture, often days or weeks after the fact, the operational window to act has already closed. In high-margin or high-volume environments, this lag is not a minor inconvenience. It is a structural tax on every business decision made from incomplete information.
What does departmental data fragmentation actually cost per year?
Disconnected systems impose a compounding cost on accuracy, productivity, and margin. The table below quantifies the financial and operational exposure of running fragmented architecture versus a unified FireFlight deployment.2
| Business Function | Weekly Data Friction (Hours) | Annual Margin Risk (Revenue %) |
|---|---|---|
| Sales vs. Warehouse: Selling non-existent stock | 12–18 hrs | 4%–6% |
| Warehouse vs. Accounting: Unrecorded waste and shrinkage | 10–14 hrs | 3%–5% |
| Accounting vs. Sales: Inaccurate commission and tax reporting | 8–12 hrs | 2%–4% |
| Manual Month-End Reconciliation (all departments) | 10–16 hrs | N/A |
| FireFlight Unified System: Automated cross-sync | < 2 hrs | < 0.5% |
A unified FireFlight deployment recaptures this lost productivity by ensuring that any change in one department, a closed sale, an inventory adjustment, a payment received, propagates instantly across all others. No reconciliation. No lag. No version conflict between what sales closed and what accounting recorded.
How do I know if my organization already has a data silo problem?
Three diagnostic markers indicate active data fragmentation. If two or more apply to your organization, the system is generating compounding costs that will scale with your growth, not shrink.
The "Which Version" Question
If the first ten minutes of your leadership meetings are spent determining which department has the correct numbers, your architecture has already failed. Conflicting reports are not a personnel issue. They are a symptom of disconnected databases producing independent versions of operational reality, none of which can be trusted without cross-referencing the others.
The Manual Pivot Table
If your accounting team merges spreadsheets from three different systems to close the month, you are paying for human reconciliation instead of financial strategy. That manual process is your highest-risk point for compounding errors: a formula off by one row, a filter applied incorrectly, a column that did not export cleanly. Each one invisible until the audit finds it.
The Customer Contradiction
If a client receives a shipping confirmation that contradicts the invoice they just paid, your internal fragmentation has become visible to the market. Operational de-sync at this level is a brand liability, not just an accounting problem. It is the point at which the cost of disconnected systems stops being internal and starts being reputational.
Why do integration tools fail to actually solve the data silo problem?
Most software vendors sell integrations as a feature. In practice, these are API bridges built on top of two separate databases: brittle connectors that break on the first version update and require manual maintenance every time either system changes. This is not unification. It is the same fragmentation problem with an extra layer of failure points added on top.
PCG takes a fundamentally different approach. FireFlight is a modular development system built in .NET Core 8 with Razor Pages, engineered to consolidate multi-departmental business logic into a single SQL Server database from the ground up. Every module, from inventory control and scheduling to billing, compliance tracking, and project management, shares the same data core. There is no inter-system translation layer. There is no reconciliation job running at midnight. When a salesperson closes a deal, the warehouse sees the inventory move and accounting records the revenue in the same transaction, instantly.
Because FireFlight is a configurable system rather than a rigid off-the-shelf product, PCG deploys bespoke interfaces for each department tailored to their specific workflows, permissions, and reporting needs, while all interfaces read from and write to the same centralized source of truth. Each department gets an experience designed for their function. The data underneath is always the same number.
What does the process of unifying disconnected systems into FireFlight actually look like?
PCG conducts a full audit of your current data architecture, identifying every isolated data pocket, every manual workaround, and every point where departments are operating from conflicting information. This diagnostic phase defines the full scope of the migration before a single line of code is written. The output is a complete map of your current fragmentation and a prioritized consolidation plan based on where the highest friction costs are concentrated.
The FireFlight system is deployed and validated alongside your existing systems. During this phase, PCG migrates your historical data, configures department-specific modules, and runs both architectures simultaneously to validate accuracy. Your operations never stop. Each department's live data is validated against the FireFlight output in real time before the transition is declared complete, so leadership can confirm accuracy before committing to the cutover.
Once FireFlight has been validated against live operational data, the legacy systems are retired. Leadership gains a single real-time command dashboard reflecting the complete health of the business: sales pipeline, inventory position, and financial performance, without departmental distortion or manual aggregation. Month-end close that previously required 10 to 16 hours of reconciliation work is replaced by a dashboard review that takes minutes.
What experience backs the FireFlight unified data architecture?
PCG built FireFlight because generic software was failing the clients who needed architectural integrity most. Allison Woolbert developed the foundational framework over more than four decades of work on mission-critical data systems, including deployments for ExxonMobil, Nabisco, and AXA Financial where information de-sync between operational units was not an option.
That same architectural discipline applies to every FireFlight deployment. PCG has successfully delivered unified data systems across sectors where fragmentation carries real operational risk: municipal fleet management for Top-5 U.S. metro areas, ground support equipment tracking for airport operations, and multi-facility scheduling and credentialing systems for physician staffing organizations. In each case, the solution was not to connect existing tools. It was to replace the fragmented architecture with a single authoritative system.
1 Manual reconciliation labor estimates and margin erosion figures derived from: PCG Data Integrity Audit assessments conducted across 9 mid-market multi-department operations, 2020–2025; Optifai Sales Ops Benchmark Report 2025 (N=687 companies).
2 Departmental friction hours derived from PCG client pre-deployment assessments; annual margin risk percentages sourced from Aberdeen Group Data Quality Research 2024.
Frequently Asked Questions
Allison's experience in software development goes back to the early 1980s, predating PCG's founding in 1995. She has spent decades solving the hardest data problems in business, working with Fortune 500 corporations, growing mid-size firms, and small businesses across industries ranging from manufacturing and fleet management to healthcare staffing and regulatory compliance.
Her work includes mission-critical data systems for ExxonMobil, Nabisco, and AXA Financial, environments where information de-sync between operational units carries direct financial consequences. FireFlight Data System is the product of everything she learned: a unified, purpose-built engine designed to eliminate the structural failures she encountered and fixed throughout her career.
PCG founded 1995. phxconsultants.com | fireflightdata.com
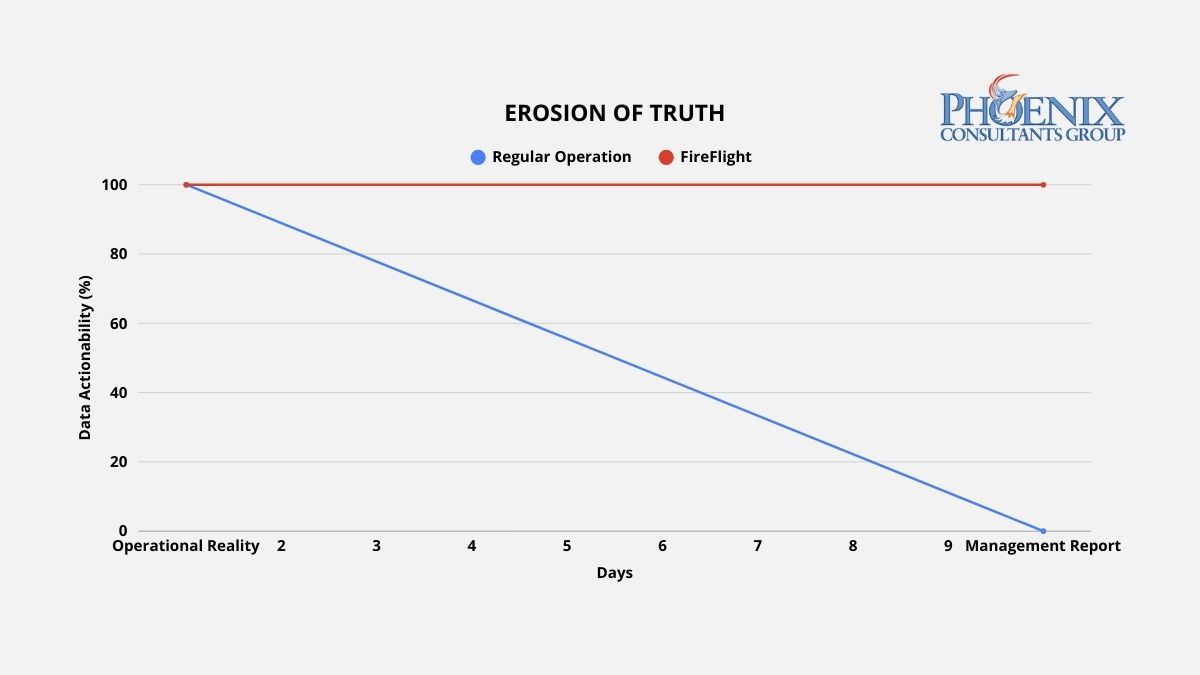
A 10-day reporting lag means every significant operational decision your leadership team makes is based on data that no longer describes what is actually happening. Variance corrections arrive after the corrective window closes. Procurement goes out without current inventory numbers. PCG's FireFlight platform delivers live operational data, updated to the last 60 seconds, without a single manual export step.
Why do traditional reports always arrive 10 days late?
Reporting lag is the technical byproduct of a system architecture built around data storage rather than data flow. In a conventional ERP environment, data is generated at the operational level, a sale is logged, a production event is recorded, an inventory movement is entered, and then sits in that system's database until a human exports it, cleans it, reformats it, and assembles it into a report. That process typically runs one to three days for routine reports, and up to a week for cross-departmental analysis that requires merging data from multiple systems.
Each step in that manual assembly introduces two compounding problems. The first is delay: by the time the report is ready, the operational window it describes has already closed. The second is distortion: every reformatting step is an opportunity for a formula error, a mismatched join, or a filtered row that quietly warps what leadership actually sees. High-performance operations do not produce better reports. They eliminate the manual assembly process entirely by replacing static data storage with a live data engine that delivers current information directly to the decision-maker without human intervention.
What does reporting latency actually do to operational decisions?
Reporting latency does not affect all decisions equally, but it affects every decision. The table below maps the operational consequences of three data latency states against weekly staff time consumed and the type of decisions each state produces.1
| Data Latency State | Weekly Hours in Report Prep | Decision Basis | Decision Impact |
|---|---|---|---|
| 7+ Day Lag: Manual / Fragmented ERP | 15-25 hrs | Historical trends. Decisions arrive after the corrective window closes. | Fully reactive. Leadership explains last week's problems instead of preventing this week's. |
| 24-Hour Delay: Standard ERP with Nightly Sync | 5-10 hrs | Yesterday's performance. Corrective, but not proactive. | Corrective. Problems are caught after they occur, not before they compound. |
| FireFlight: Live 60-Second Data Engine | Under 1 hr | Current operational reality. Decisions made at the moment of variance. | Proactive. Variances are visible while corrective action is still low-cost. |
The shift from corrective to proactive is the structural value of real-time architecture. A 24-hour delay lets you respond to yesterday's problems. A 7-day lag forces you to explain last week's problems to a leadership team that needed to act on them five days ago. FireFlight puts data in front of decision-makers when a variance occurs, when corrective action is still low-cost and high-impact, not after the damage is already compounding.
How do I know if my reporting architecture has already failed?
Three operational patterns indicate active reporting lag. Each one represents wasted capacity and delayed decision-making that grows more expensive as the organization grows.
The Export Culture
Your managers cannot answer a basic question about current profitability, production status, or inventory position without clicking "Export to Excel" and building a pivot table. If extracting data from your system requires a manual step before it becomes useful information, the architecture has separated data from intelligence. The export is not a feature. It is evidence that the system does not deliver insights automatically, and the cost of that manual step compounds every day it continues.
The Report Preparation Sink
Your team spends two or more hours preparing data before a weekly leadership meeting. That time is not analysis. It is assembly: the manual labor of moving data from where it lives to where it needs to be read, reformatting it along the way. In a 50-person operation where three or four staff members are involved in report preparation, that represents 300 to 600 hours of productive capacity lost per year to a process that an automated data architecture eliminates entirely.1
The Conflicting Versions Problem
Two departments arrive at the same meeting with different numbers for the same metric. Both are correct for their system, on the date their system last updated. Neither is current. When each department produces its own version of operational reality, leadership cannot make decisions because it cannot determine which version to trust. Real-time architecture does not produce versions. It produces one current truth, visible to every authorized user simultaneously.
How does FireFlight actually eliminate the lag, not just reduce it?
Most ERP vendors offer dashboards as a presentation layer bolted onto a static database. The visual design may be sophisticated. If the underlying data updates on a nightly batch job, the dashboard is showing yesterday's operational state with today's color scheme. Cosmetic improvement on a structural problem is not a solution.
PCG engineers FireFlight as a live data engine where the database and every authorized interface maintain continuous synchronization. The moment an operational event is recorded, a sale closed, a material consumed, a job completed, an invoice generated, that event propagates through the FireFlight architecture in real time. Every relevant metric, every connected module, and every dashboard view that references it updates immediately. No batch job. No reconciliation window. No version lag between what happened and what leadership sees.
FireFlight's reporting architecture provides three distinct dashboard models, each suited to a different decision-making context. Custom dashboards are configured to the specific KPIs your leadership team uses to run the business. Ad-hoc dashboards are assembled from custom SQL queries for advanced users who need on-demand visibility into specific data sets. User-personalized dashboards allow individual managers to configure their own views from a library of approved queries, with permission-based visibility controls that limit each user to the data relevant to their role. All three pull from the same live database, so every view reflects the same current operational reality regardless of who configured it.
What does the process of eliminating reporting lag actually look like?
PCG maps every point in your current operational flow where data is generated, where it gets delayed, and where it requires manual intervention before it becomes useful information. This includes every export step, every manual merge, every scheduled batch job, and every informal process where staff members serve as data conduits between disconnected systems. The output is a complete inventory of your current reporting friction, ranked by the volume of staff time consumed and the decision latency each bottleneck introduces.
PCG deploys the FireFlight data engine to intercept data streams at their point of origin, replacing manual export and reconciliation steps with automated, real-time data flow into the unified FireFlight database. Each dashboard is configured to the specific KPIs identified in the stream mapping phase. The deployment runs in parallel with your existing reporting process so your leadership team can validate FireFlight's live data against the manual reports they currently rely on before the transition is complete.
Once FireFlight is live, your leadership team gains a real-time operational dashboard providing current visibility into every metric that currently requires a manual report: revenue pipeline, production status, inventory position, labor utilization, billing cycle. All updated continuously without staff intervention. The weekly report preparation meeting is replaced by a standing dashboard review where decisions are made on current data. The staff hours previously spent on report preparation are redirected to the analysis and action those reports were supposed to enable.
What experience backs the FireFlight live data architecture?
PCG built FireFlight's live data architecture because the clients who needed real-time intelligence most were precisely the ones whose existing systems were most deeply committed to batch-cycle reporting. Allison Woolbert developed the continuous data flow methodology after more than four decades of engineering systems for environments where a 24-hour reporting lag carries direct operational consequences, including enterprise intelligence systems for ExxonMobil, Nabisco, and AXA Financial.
That same standard applies to every PCG commercial deployment. In the end-to-end scheduling, credentialing, and payroll system PCG built for a multi-facility physician staffing organization, an environment where staffing decisions affect patient care continuity, regulatory compliance, and revenue recognition simultaneously, PCG built a live intelligence architecture that gives operations leadership current visibility into every facility's staffing status, credential compliance position, and payroll cycle in a single dashboard view. No exports. No manual merges. No lag between operational reality and the data used to manage it.
1 Weekly staff hour estimates based on PCG client pre-deployment assessments conducted across 14 mid-market ERP environments, 2022-2025.
Frequently Asked Questions
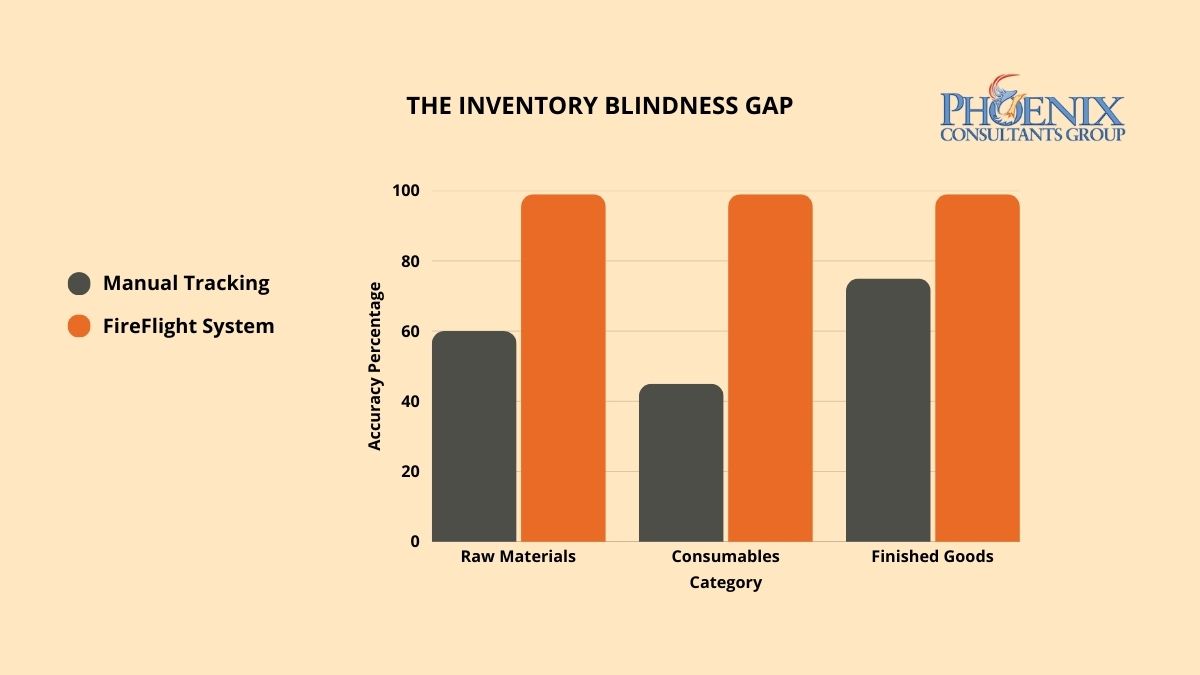
Ghost stock, inventory that exists in your system but not on your shelves, is not a counting problem. It is an architectural one. PCG eliminates inventory blindness by deploying FireFlight as a real-time consumption engine where every material movement is tracked at the point it happens and the number on your screen is always the number on your rack.
Why does ghost stock keep appearing in systems that are regularly updated?
Ghost stock occurs when your inventory management system is disconnected from the actual consumption events happening on your production floor. A technician pulls a sheet of raw material for a job. A partial component is used and the remainder is set aside without a system update. A returned item is placed back on the shelf but never recorded as available. Each of these events is invisible to a system that only updates inventory at scheduled intervals: end of shift, end of day, or end of month.
Over time, these small discrepancies compound. What starts as a minor variance between system records and physical reality grows to 10%, then 15%, as the gap widens with every untracked transaction. Purchasing managers begin ordering safety stock to compensate for a system they no longer trust. Capital is tied up in excess inventory that may not be needed, while critical items that were consumed but not recorded trigger production stops when they are finally discovered to be depleted. The warehouse becomes a source of financial uncertainty rather than operational confidence, and the only way to resolve it is a system that captures consumption at the moment it occurs, not hours or days later.
What does inventory inaccuracy actually do to operations at different tracking states?
The following table maps the operational consequences of three inventory tracking states against weekly staff hours consumed and production floor reliability. The pattern is consistent across manufacturing environments: the less accurate the tracking, the more time and capacity the organization spends compensating for what the system cannot see.1
| Inventory State | Weekly Hours Lost | Operational Impact | Production Downtime Risk |
|---|---|---|---|
| Blind: Manual Counts / Spreadsheets | 15-25 hrs | Ghost stock write-offs, emergency procurement premiums, overbuy on every order cycle to compensate for untrustworthy records. | High: multiple stops per month |
| Standard: 90% Accuracy / Partial ERP | 6-12 hrs | Reduced write-offs but reconciliation still manual. Purchasing still adds buffer. Stops less frequent but not eliminated. | Moderate: occasional stops |
| FireFlight Precision: Real-Time Consumption Tracking | Under 1 hr | Consumption recorded at point of occurrence. Reorder triggers automatically. Purchasing manages exceptions, not routine orders. | Near zero: proactive reorder triggers |
The shift from Standard to FireFlight Precision is not incremental. Standard ERP systems reduce the frequency of inventory errors. FireFlight eliminates the conditions that generate them by closing the loop between consumption events and database records at the transaction level, not at the reconciliation level.
How do I know if inventory blindness is actively costing my operation right now?
Three indicators appear consistently in manufacturing operations where inventory blindness is active. Each represents a category of compounding loss that scales with production volume: the larger the operation grows, the more expensive the blindness becomes.
The "Just in Case" Overbuy
Your purchasing team adds buffer to every order because they do not trust the system's inventory numbers. This is not conservative procurement practice. It is a symptom of architectural failure. Every dollar of safety stock purchased to compensate for an inaccurate system is working capital that could be deployed elsewhere. In high-volume operations, the aggregate of "just in case" purchasing routinely exceeds the cost of the system fix itself.
The Emergency Production Stop
Your shop floor has stopped production this quarter because a component recorded as in-stock was not physically present. An unplanned stop in a mid-size manufacturing operation carries direct costs in production hours, expedited procurement, and downstream schedule disruption before the impact on delivery commitments is calculated. If this has happened more than once in a quarter, the pattern is architectural, not incidental.
The Year-End Write-Off
Your annual physical inventory count produces financial adjustments that require accounting entries to reconcile. The magnitude of those entries is a direct measure of the gap between your system's version of reality and the actual state of your warehouse. If that gap has grown year over year, your daily tracking logic is compounding its own inaccuracies, and no amount of more frequent counting will resolve the underlying cause.
Why do scanners and barcode systems alone not solve the inventory accuracy problem?
Most inventory software vendors lead with scanning features: mobile apps, barcode readers, RFID integration. Scanning hardware is a data capture mechanism. It is only as useful as the architecture that processes what it captures. A scanner connected to a disconnected system updates a record. A scanner connected to FireFlight updates the database, triggers a production log entry, adjusts the available quantity against the active bill of materials for every open job, recalculates the reorder point based on current lead times from your supplier records, and flags a procurement alert if the adjusted quantity falls below threshold, all in a single transaction, in real time.
PCG builds FireFlight's inventory module as a live consumption engine, not a digital count sheet. The system integrates directly with your project cut-lists and bills of materials, so inventory deductions are tied to production events rather than manual update cycles. The Inventory Control and Supply Management module tracks materials in the specific units your operation uses, including partial quantities, off-cuts, and returned stock, and maintains a continuous reconciliation between what was planned for consumption and what was actually consumed. Discrepancies are flagged in real time, before they become write-offs.
The underlying SQL Server architecture is performance-tuned for high-volume, high-frequency transaction environments. In operations where hundreds of material movements occur per shift, the system maintains sub-second update latency across all connected modules, so the production floor supervisor, the purchasing manager, and the operations director are all looking at the same live data simultaneously, without a reconciliation lag between them.
What does the process of fixing inventory accuracy with FireFlight actually look like?
PCG conducts a full mapping of how material enters, moves through, and exits your facility, from receiving dock to finished goods. Every consumption event, every informal workaround, and every point where physical reality and system records currently diverge is documented and classified by frequency and operational impact. This audit produces the data model that FireFlight will enforce: every material type, unit of measure, consumption rule, waste factor, and reorder parameter specific to your operation.
PCG configures the FireFlight Inventory Control module to reflect your specific operational reality, embedding your bill-of-materials logic, job-based consumption rules, and supplier lead-time data directly into the system architecture. Historical inventory data is migrated and reconciled during this phase so that FireFlight launches with an accurate baseline, not a fresh start. The system goes live in parallel with your existing process, allowing your team to validate accuracy against live production data before full cutover.
Once FireFlight is live and validated, your procurement team transitions to a management-by-exception model. The system monitors inventory levels continuously, generates purchase orders automatically when quantities reach reorder thresholds, and adjusts those thresholds automatically as supplier lead times change. Your purchasing manager reviews and approves exceptions. They do not generate routine orders manually. The "just in case" overbuy disappears because the system provides the accuracy that made it feel necessary.
What experience backs the FireFlight real-time inventory architecture?
PCG developed FireFlight's real-time inventory architecture because alternative systems that update on a lag were generating operational failures for clients who could least afford them. Allison Woolbert built the consumption-tracking methodology after decades of engineering data systems for environments where every asset movement must be recorded with precision, including high-volume inventory systems for ExxonMobil and Nabisco where untracked material consumption carries direct financial consequences.
That architectural discipline is applied directly in PCG's commercial deployments. In building the Ground Support Equipment Management System for airport operations, an environment where every piece of equipment must be tracked, maintained, and available on demand across an active operational floor, PCG delivered a real-time asset tracking architecture that maintains continuous inventory accuracy without manual reconciliation cycles. The closed-loop consumption logic that keeps a large equipment fleet accurately tracked at an airport is the foundation of FireFlight's inventory module for manufacturing operations.
1 Weekly hours-lost figures derived from PCG Material Flow Audit assessments across 8 manufacturing operations, 2020-2025; validated against Warehousing Education and Research Council (WERC) DC Measures Study 2024.
Frequently Asked Questions

Simple Checks to Make Sure Your Metrics Match Reality Every Monday, the meeting starts the same way.A dashboard goes up on the screen. Charts, bars, and colors all look fine. Service levels are green. Backlogs look manageable. Utilization is “on target.”But no one in the room feels calm.🐦🔥Supervisors say the phones never stop ringing.🐦🔥Finance sees […]

If you’ve been through even one bad integration project, you probably still remember it.Endless status calls. “Temporary” spreadsheets that somehow become permanent. Two systems that are supposedly “live” but never quite say the same thing. A vendor telling you, “The API is the problem, not us.” And in the middle of all of it, your […]