
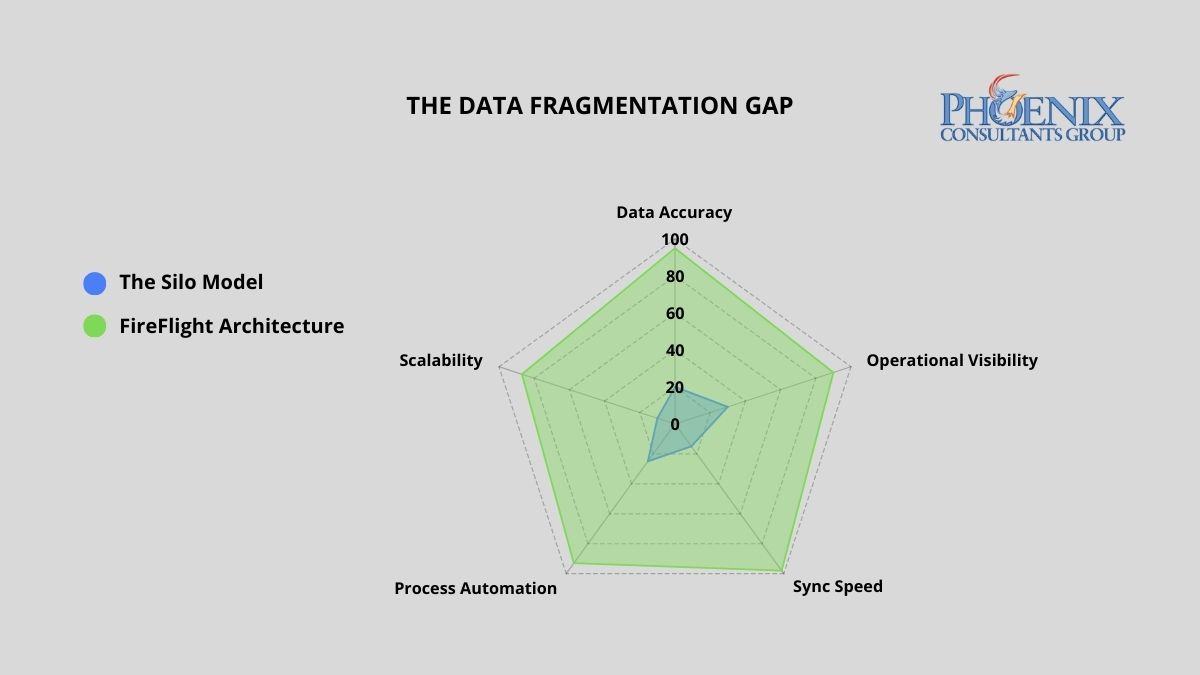
FireFlight's unified architecture outperforms the fragmented data silo model across every operational dimension. The gap widens as transaction volume and department count increase, because fragmentation compounds while unification does not.
Why do data silos keep forming even in well-managed organizations?
Data fragmentation rarely happens by design. It is the byproduct of rapid growth. As companies scale, each department purchases the tool that solves its immediate problem: the sales team adopts a CRM, the warehouse selects a standalone inventory tracker, and accounting continues with a legacy ledger system. These tools were engineered to serve individual functions, not to share a common data language.
The result is a growing network of information islands where data is trapped within the department that collected it. By the time leadership reconciles those islands into a coherent picture, often days or weeks after the fact, the operational window to act has already closed. In high-margin or high-volume environments, this lag is not a minor inconvenience. It is a structural tax on every business decision made from incomplete information.
What has changed about the cost of data silos in 2026?
The operational costs described in this guide have not gone away. What changed in 2026 is that a second, larger cost sits on top of them: fragmented data is now the single biggest thing standing between a business and any working use of AI.
- 95 percent of IT leaders now name integration issues, not algorithms and not compute, as the primary barrier to adopting AI.3 The bottleneck is getting the right data to the right place, which is exactly the problem silos create.
- Poor data quality and siloed architecture cost organizations an estimated 12.9 to 15 million dollars per year, according to 2026 Gartner and IBM benchmarks.4
- Roughly 71 percent of business applications remain disconnected, and close to 80 percent of enterprise AI initiatives fail to scale because their data is trapped across fragmented systems.3
The practical consequence for an executive in 2026: an AI tool can only reason over the data it can see. When orders live in one system, inventory in another, and financials in a third, the AI sees fragments and produces fragmented answers. A unified data core is not a nice-to-have for an AI strategy. It is the precondition.
What does departmental data fragmentation actually cost per year?
Disconnected systems impose a compounding cost on accuracy, productivity, and margin. The table below quantifies the financial and operational exposure of running fragmented architecture versus a unified FireFlight deployment.2
| Business function | Weekly data friction (hours) | Annual margin risk (revenue %) |
|---|---|---|
| Sales vs. Warehouse: Selling non-existent stock | 12-18 hrs | 4%-6% |
| Warehouse vs. Accounting: Unrecorded waste and shrinkage | 10-14 hrs | 3%-5% |
| Accounting vs. Sales: Inaccurate commission and tax reporting | 8-12 hrs | 2%-4% |
| Manual Month-End Reconciliation (all departments) | 10-16 hrs | N/A |
| FireFlight Unified System: Automated cross-sync | < 2 hrs | < 0.5% |
A unified FireFlight deployment recaptures this lost productivity by making any change in one department, a closed sale, an inventory adjustment, a payment received, propagate instantly across all others, with no reconciliation, no lag, and no version conflict between what sales closed and what accounting recorded.
How do I know if my organization already has a data silo problem?
Three diagnostic markers indicate active data fragmentation. If two or more apply to your organization, the system is generating compounding costs that will scale with your growth, not shrink.
The "Which Version" Question
If the first ten minutes of your leadership meetings are spent determining which department has the correct numbers, your architecture has already failed. Conflicting reports are not a personnel issue. They are a symptom of disconnected databases producing independent versions of operational reality, none of which can be trusted without cross-referencing the others.
The Manual Pivot Table
If your accounting team merges spreadsheets from three different systems to close the month, you are paying for human reconciliation instead of financial strategy. That manual process is your highest-risk point for compounding errors: a formula off by one row, a filter applied incorrectly, a column that did not export cleanly. Each one invisible until the audit finds it.
The Customer Contradiction
If a client receives a shipping confirmation that contradicts the invoice they just paid, your internal fragmentation has become visible to the market. Operational de-sync at this level is a brand liability, not just an accounting problem. It is the point at which the cost of disconnected systems stops being internal and starts being reputational.
Why do integration tools fail to actually solve the data silo problem?
Most software vendors sell integrations as a feature. In practice, these are API bridges built on top of two separate databases: brittle connectors that break on the first version update and require manual maintenance every time either system changes. This is not unification. It is the same fragmentation problem with an extra layer of failure points added on top.
PCG takes a fundamentally different approach. FireFlight is a modular development system built in .NET Core 8 with Razor Pages, engineered to consolidate multi-departmental business logic into a single SQL Server database from the ground up. Every module, from inventory control and scheduling to billing, compliance tracking, and project management, shares the same data core. There is no inter-system translation layer, and no reconciliation job running at midnight. When a salesperson closes a deal, the warehouse sees the inventory move and accounting records the revenue in the same transaction, instantly.
Because FireFlight is a configurable system rather than a rigid off-the-shelf product, PCG deploys bespoke interfaces for each department tailored to their specific workflows, permissions, and reporting needs, while all interfaces read from and write to the same centralized source of truth. Each department gets an experience designed for their function. The data underneath is always the same number. Where a full replacement is not the right first step, the same principle can be reached through data movement and middleware integration that connects systems that were not designed to talk.
What does the process of unifying disconnected systems into FireFlight actually look like?
Silo Mapping
PCG conducts a full audit of your current data architecture, identifying every isolated data pocket, every manual workaround, and every point where departments are operating from conflicting information. This diagnostic phase defines the full scope of the migration before a single line of code is written. The output is a complete map of your current fragmentation and a prioritized consolidation plan based on where the highest friction costs are concentrated.
Parallel Deployment
The FireFlight system is deployed and validated alongside your existing systems. During this phase, PCG migrates your historical data, configures department-specific modules, and runs both architectures simultaneously to validate accuracy. Your operations never stop. Each department's live data is validated against the FireFlight output in real time before the transition is declared complete, so leadership can confirm accuracy before committing to the cutover.
The Clean Cutover
Once FireFlight has been validated against live operational data, the legacy systems are retired. Leadership gains a single real-time command dashboard reflecting the complete health of the business: sales pipeline, inventory position, and financial performance, without departmental distortion or manual aggregation. Month-end close that previously required 10 to 16 hours of reconciliation work is replaced by a dashboard review that takes minutes.
What experience backs the FireFlight unified data architecture?
PCG built FireFlight because generic software was failing the clients who needed architectural integrity most. Allison Woolbert developed the foundational framework over more than four decades of work on mission-critical data systems, including projects with corporations such as ExxonMobil, Nabisco, and AXA Financial, where information de-sync between operational units was not an option.
That same architectural discipline applies to every FireFlight deployment. PCG has delivered unified data systems across sectors where fragmentation carries real operational risk: municipal fleet management for Top-5 U.S. metro areas, ground support equipment tracking for airport operations, and multi-facility scheduling and credentialing systems for physician staffing organizations. In each case, the work was not to connect existing tools. It was to replace the fragmented architecture with a single authoritative system. The same fragmentation shows up acutely when a business depends on spreadsheets, a pattern covered in the spreadsheet trap and the manual workaround tax.
Key takeaways
- Data silos cost the average mid-size operation 40 or more staff hours per week in reconciliation and erode 9 to 15 percent of annual revenue in reporting and inventory errors.
- In 2026 a second cost sits on top: 95 percent of IT leaders name integration issues, not algorithms, as the primary barrier to AI adoption, and poor data quality costs organizations an estimated 12.9 to 15 million dollars a year.
- Integration tools are API bridges on top of separate databases that break on version updates. They add failure points rather than removing fragmentation.
- FireFlight consolidates every department into a single SQL Server core, so a closed sale, an inventory move, and a recorded payment happen in one transaction with no reconciliation job.
- A unified data core is the precondition for any AI initiative, because an AI tool can only reason over the data it can actually see.
How long does a full migration to FireFlight actually take?
Can we keep some of our existing tools and still achieve a unified source of truth?
Does centralizing data into one system create a single point of failure?
What is the measurable ROI of moving to a unified data system?
Do individual departments lose flexibility when everything moves to one system?
What does data silo fragmentation actually cost per year?
How is FireFlight different from buying an integration tool that connects our existing systems?
Why do data silos block AI adoption?
Sources
- Manual reconciliation labor estimates and margin erosion figures derived from PCG Data Integrity Audit assessments conducted across 9 mid-market multi-department operations, 2020-2025, and the Optifai Sales Ops Benchmark Report 2025 (N=687 companies).
- Departmental friction hours derived from PCG client pre-deployment assessments; annual margin risk percentages sourced from Aberdeen Group Data Quality Research 2024.
- 2026 data integration statistics: 95% of IT leaders cite integration as the primary AI-adoption barrier (Salesforce); ~71% of business applications remain disconnected; close to 80% of enterprise AI initiatives fail to scale due to fragmented data. Compiled via Peliqan and Integrate.io 2026 reporting.
- Gartner and IBM 2026 benchmarks on the annual cost of poor data quality and siloed architecture (estimated 12.9 to 15 million dollars per organization).
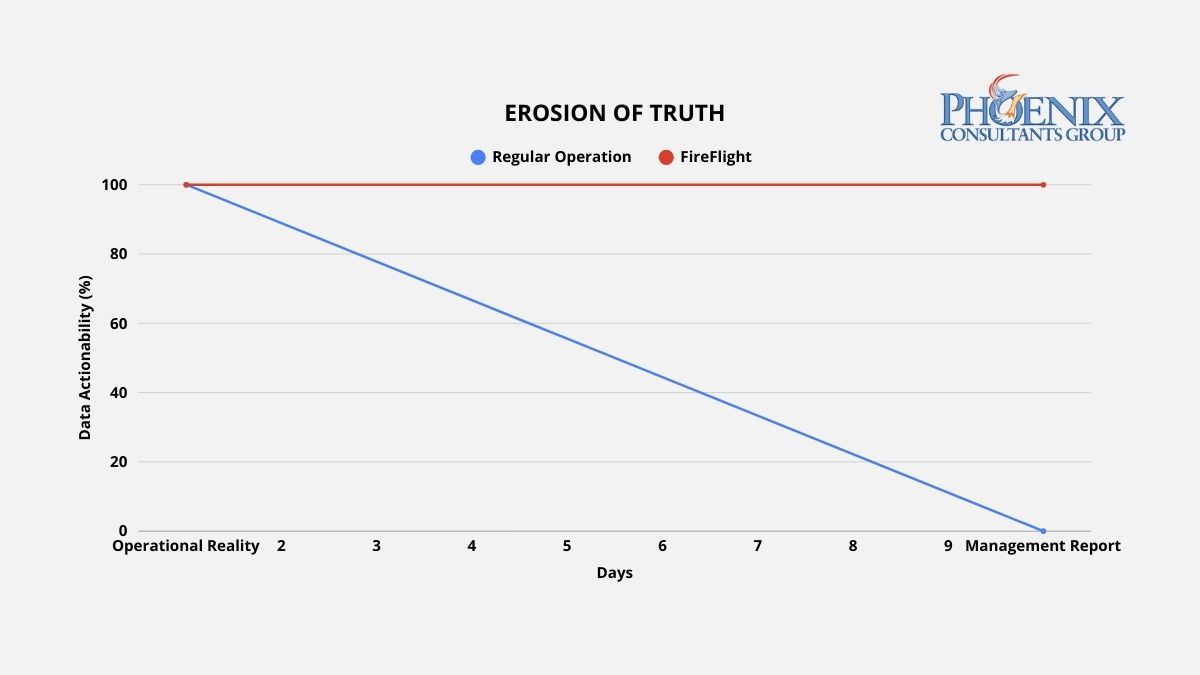
Data actionability drops sharply within 48 hours of a reporting cycle in standard ERP environments. FireFlight's live architecture holds actionability constant because the data never ages out of relevance.
Why do traditional reports always arrive 10 days late?
Reporting lag is the technical byproduct of a system architecture built around data storage rather than data flow. In a conventional ERP environment, data is generated at the operational level, a sale is logged, a production event is recorded, an inventory movement is entered, and then sits in that system's database until a human exports it, cleans it, reformats it, and assembles it into a report. That process typically runs one to three days for routine reports, and up to a week for cross-departmental analysis that requires merging data from multiple systems.
Each step in that manual assembly introduces two compounding problems. The first is delay: by the time the report is ready, the operational window it describes has already closed. Then comes distortion, because every reformatting step is an opportunity for a formula error, a mismatched join, or a filtered row that quietly warps what leadership actually sees. High-performance operations do not produce better reports. They eliminate the manual assembly process entirely by replacing static data storage with a live data engine that delivers current information directly to the decision-maker without human intervention.
Why is real-time data the precondition for using AI in 2026?
The reporting-lag problem got more expensive in 2026, because the same stale data that misleads a leadership team also cripples any AI initiative built on top of it. An AI model is only as current as the data feeding it, and a model reasoning about a 10-day-old version of the business produces recommendations that arrive after the window to act on them has closed.
- Roughly 80 percent of organizations still rely on stale data for decision-making, and 85 percent of data leaders say decisions made on outdated data have directly cost their companies money.2
- About 75 percent of AI analytics projects fail to scale past the pilot stage, most often because of data fragmentation and integration gaps rather than the model itself.3
- Companies that pair AI with real-time data are roughly five times more likely to improve decision speed and operational efficiency than those running on batch-cycle reporting.3
The practical order of operations for 2026: the live data engine comes first, the AI comes second. An organization that fixes its reporting lag is not just making better decisions this quarter. It is building the current, unified data foundation that any AI tool needs before it can produce anything a leadership team should trust.
What does reporting latency actually do to operational decisions?
Reporting latency does not affect all decisions equally, but it affects every decision. The table below maps the operational consequences of three data latency states against weekly staff time consumed and the type of decisions each state produces.1
| Data latency state | Weekly hours in report prep | Decision basis | Decision impact |
|---|---|---|---|
| 7+ Day Lag: Manual / Fragmented ERP | 15-25 hrs | Historical trends. Decisions arrive after the corrective window closes. | Fully reactive. Leadership explains last week's problems instead of preventing this week's. |
| 24-Hour Delay: Standard ERP with Nightly Sync | 5-10 hrs | Yesterday's performance. Corrective, but not proactive. | Corrective. Problems are caught after they occur, not before they compound. |
| FireFlight: Live 60-Second Data Engine | Under 1 hr | Current operational reality. Decisions made at the moment of variance. | Proactive. Variances are visible while corrective action is still low-cost. |
The shift from corrective to proactive is the structural value of real-time architecture. A 24-hour delay lets you respond to yesterday's problems. Anything past a week forces you to explain last week's problems to a leadership team that needed to act on them five days ago. FireFlight puts data in front of decision-makers when a variance occurs, when corrective action is still low-cost and high-impact, not after the damage is already compounding.
How do I know if my reporting architecture has already failed?
Three operational patterns indicate active reporting lag. Each one represents wasted capacity and delayed decision-making that grows more expensive as the organization grows.
The Export Culture
Your managers cannot answer a basic question about current profitability, production status, or inventory position without clicking "Export to Excel" and building a pivot table. If extracting data from your system requires a manual step before it becomes useful information, the architecture has separated data from intelligence. The export is not a feature. It is evidence that the system does not deliver insights automatically, and the cost of that manual step compounds every day it continues.
The Report Preparation Sink
Your team spends two or more hours preparing data before a weekly leadership meeting. That time is not analysis. It is assembly: the manual labor of moving data from where it lives to where it needs to be read, reformatting it along the way. In a 50-person operation where three or four staff members are involved in report preparation, that represents 300 to 600 hours of productive capacity lost per year to a process that an automated data architecture eliminates entirely.1
The Conflicting Versions Problem
Two departments arrive at the same meeting with different numbers for the same metric. Both are correct for their system, on the date their system last updated. Neither is current. When each department produces its own version of operational reality, leadership cannot make decisions because it cannot determine which version to trust. Real-time architecture does not produce versions. It produces one current truth, visible to every authorized user simultaneously. This is the same fragmentation covered in the hidden cost of data silos.
How does FireFlight actually eliminate the lag, not just reduce it?
Most ERP vendors offer dashboards as a presentation layer bolted onto a static database. The visual design may be sophisticated. If the underlying data updates on a nightly batch job, the dashboard is showing yesterday's operational state with today's color scheme. Cosmetic improvement on a structural problem does not fix the structure.
PCG engineers FireFlight as a live data engine where the database and every authorized interface maintain continuous synchronization. The moment an operational event is recorded, a sale closed, a material consumed, a job completed, an invoice generated, that event propagates through the FireFlight architecture in real time. Every relevant metric, every connected module, and every dashboard view that references it updates immediately, with no batch job, no reconciliation window, and no version lag between what happened and what leadership sees.
FireFlight's reporting architecture provides three distinct dashboard models, each suited to a different decision-making context. Custom dashboards are configured to the specific KPIs your leadership team uses to run the business. Ad-hoc dashboards are assembled from custom SQL queries for advanced users who need on-demand visibility into specific data sets. User-personalized dashboards allow individual managers to configure their own views from a library of approved queries, with permission-based visibility controls that limit each user to the data relevant to their role. All three pull from the same live database, so every view reflects the same current operational reality regardless of who configured it.
What does the process of eliminating reporting lag actually look like?
Data Stream Identification
PCG maps every point in your current operational flow where data is generated, where it gets delayed, and where it requires manual intervention before it becomes useful information. This includes every export step, every manual merge, every scheduled batch job, and every informal process where staff members serve as data conduits between disconnected systems. The output is a complete inventory of your current reporting friction, ranked by the volume of staff time consumed and the decision latency each bottleneck introduces.
Live System Integration
PCG deploys the FireFlight data engine to intercept data streams at their point of origin, replacing manual export and reconciliation steps with automated, real-time data flow into the unified FireFlight database. Each dashboard is configured to the specific KPIs identified in the stream mapping phase. The deployment runs in parallel with your existing reporting process, the same zero-downtime parallel method PCG uses for full ERP replacement, so your leadership team can validate FireFlight's live data against the manual reports they currently rely on before the transition is complete.
The Operational Command View
Once FireFlight is live, your leadership team gains a real-time operational dashboard providing current visibility into every metric that currently requires a manual report: revenue pipeline, production status, inventory position, labor utilization, billing cycle. All updated continuously without staff intervention. The weekly report preparation meeting is replaced by a standing dashboard review where decisions are made on current data. Staff hours previously spent on report preparation are redirected to the analysis and action those reports were supposed to enable.
What experience backs the FireFlight live data architecture?
PCG built FireFlight's live data architecture because the clients who needed real-time intelligence most were precisely the ones whose existing systems were most deeply committed to batch-cycle reporting. Allison Woolbert developed the continuous data flow methodology after three decades of engineering systems for environments where a 24-hour reporting lag carries operational consequences, including data frameworks for the United States Air Force where decision latency is measured in minutes, not days.
That same standard applies to every PCG commercial deployment, informed by work with corporations such as ExxonMobil, Nabisco, and AXA Financial where the cost of delayed operational data is measured directly. In the end-to-end scheduling, credentialing, and payroll system PCG built for a multi-facility physician staffing organization, an environment where staffing decisions affect patient care continuity, regulatory compliance, and revenue recognition simultaneously, PCG built a live intelligence architecture that gives operations leadership current visibility into every facility's staffing status, credential compliance position, and payroll cycle in a single dashboard view, with no exports, no manual merges, and no lag between operational reality and the data used to manage it.
Key takeaways
- A reporting lag of a week or more means every major decision runs on data that no longer describes the business, turning leadership reactive by design.
- The lag is architectural, not a discipline problem: it comes from systems built around data storage and manual export rather than continuous data flow.
- In 2026 the lag also blocks AI: about 80 percent of organizations still decide on stale data, and roughly 75 percent of AI analytics projects fail to scale past pilots because of fragmented, delayed data.
- FireFlight is a live data engine, not a dashboard bolted onto a nightly batch job. Operational events propagate to every view in real time, with no reconciliation window.
- PCG deploys the live engine in parallel with existing reports and validates against them, so the switch to real-time data carries no gap in reporting.
How difficult is it to configure FireFlight dashboards for our specific KPIs?
Does real-time data processing slow down our operational system?
How do we know real-time data is accurate and not just fast?
Can we control which executives and managers see which data in the live dashboard?
What happens to our existing reports during the transition to FireFlight?
What is the real operational impact of a 10-day reporting lag?
How long does it take to eliminate reporting lag with FireFlight?
Why does reporting lag block AI adoption in 2026?
Sources
- Weekly staff hour estimates based on PCG client pre-deployment assessments conducted across 14 mid-market ERP environments, 2022-2025.
- IBM, "The real cost of delayed data" (2026): 80% of organizations still rely on stale data for decision-making; 85% of data leaders say decisions on outdated data have directly cost their companies money. ibm.com
- 2026 analytics research: roughly 75% of AI analytics projects fail to scale past pilot stage due to data fragmentation and integration; McKinsey finding that AI paired with real-time data makes organizations about 5x more likely to improve decision speed and efficiency.

Most businesses don’t realize how damaging data silos are until the problems become impossible to ignore. A silo forms when departments or systems can’t share information easily — sales has one set of data, finance another, operations another. On the surface, things may appear functional. But beneath the surface, silos quietly cost businesses real money […]